Ethereum (ETH) Pushes on the Upside, Pauses at the $2,000 Overhead Resistance
Estimated Reading Time: 2 minutes
Don’t invest unless you’re prepared to lose all the money you invest. This is a high-risk investment and you are unlikely to be protected if something goes wrong. Take 2 minutes to learn more
Technical indicators:
Major Resistance Levels – $2,000, $2, 500, $2,700
Major Support Levels – $1.500, $1,300, $1,100
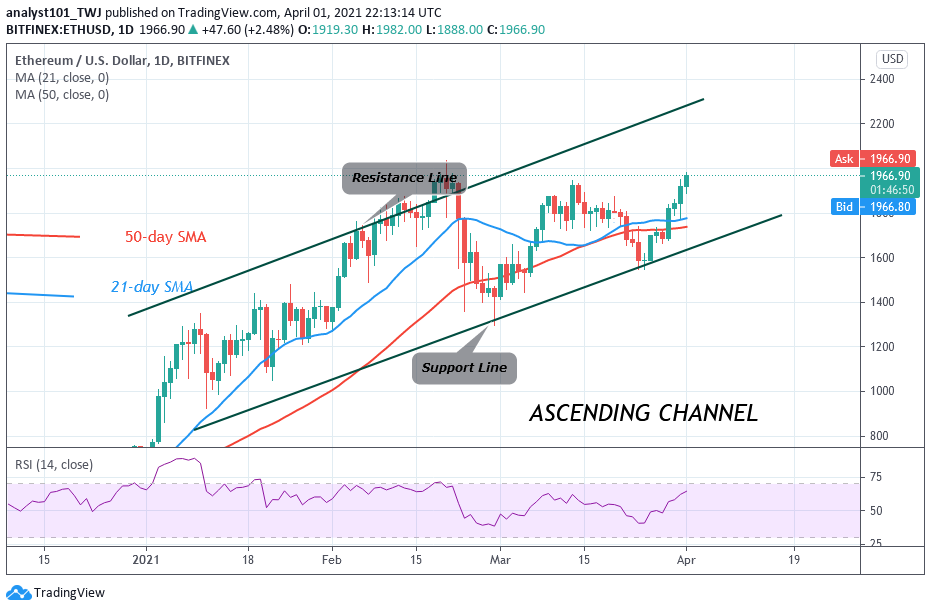
Ethereum Price Long-Term Analysis: Bullish
Ether price has made positive moves into the overhead resistance zone. Buyers have pushed the crypto in the overbought region of the market. The current bullish momentum is likely to reach bullish exhaustion. Ethereum price is approaching the February 20 high of $2,036. On February 20, the bulls were resisted as the altcoin plunged to $1,400 low. The upward move is doubtful as prices reach the overbought region of the market.
Ethereum Indicator Analysis
The crypto’s price has broken above the 21-day and 50-day SMA which indicates a possible movement of price. The moving averages are pointing northward indicating an uptrend. The crypto is at level 64 of the Relative Strength index period 14. It indicates that price is approaching the overbought region. The crypto may not have room to rally on the upside.
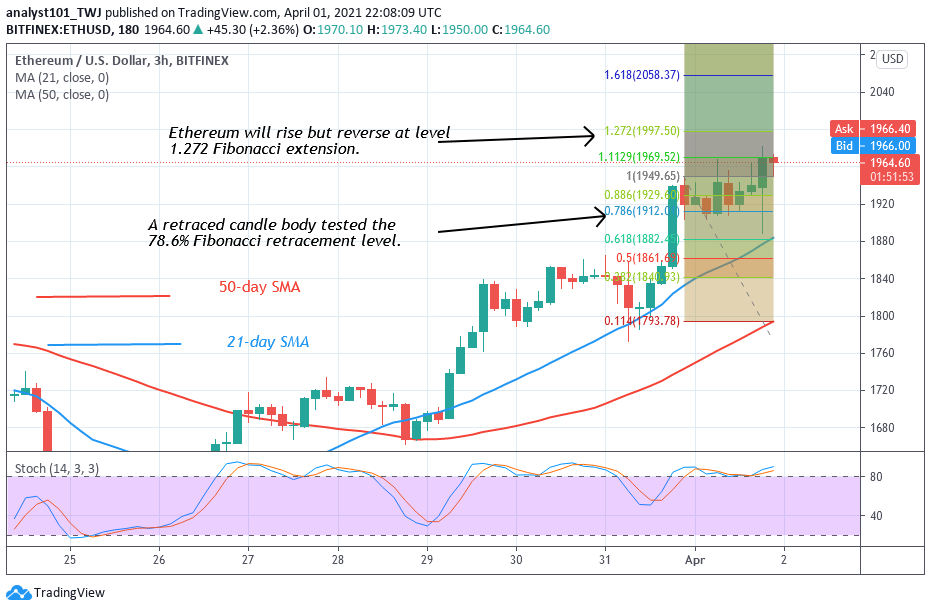
What Is the Next Direction for Ethereum?
Ethereum’s upward move is marginal as the altcoin will retest the resistance zone and reverse. On March 31 uptrend; the altcoin was repelled at the $1,943 high. The retraced candle body tested the 78.6 % Fibonacci retracement level. This retracement implies that Ethereum will rise and reverse at level 1.272 Fibonacci extension
You can purchase crypto coins here: Buy Coins