Ethereum (ETH) Reaches Bearish Exhaustion above $2,100, Uptrend Likely
Estimated Reading Time: 2 minutes
Don’t invest unless you’re prepared to lose all the money you invest. This is a high-risk investment and you are unlikely to be protected if something goes wrong. Take 2 minutes to learn more
Ethereum Price Long-Term Analysis: Bearish
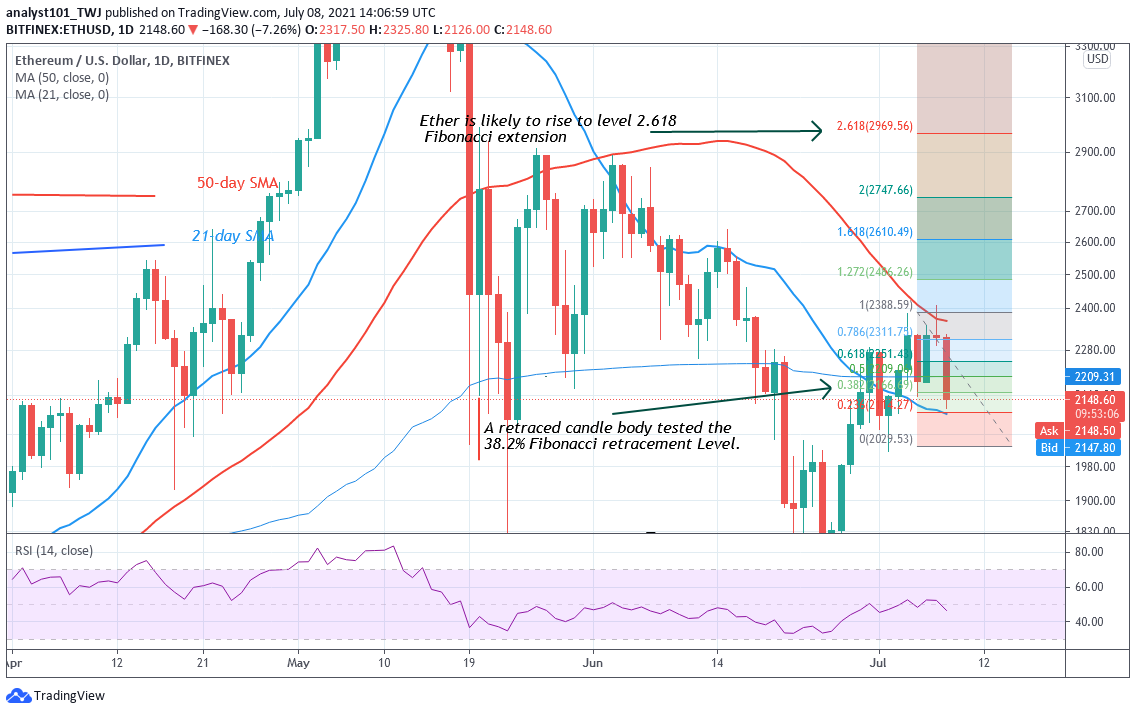
For the past 48 hours, Ethereum has been in a downward move. The biggest altcoin was rejected at the $2,400 high. Today, Ether has declined to $2,100 low. The biggest altcoin is above the 21-day SMA. If the current support levels hold, ETH/USD will resume upside momentum. Meanwhile, on July 5 uptrend; a retraced candle body tested the 38.2% Fibonacci retracement level. The retracement indicates that Ether will rise to level 2.618 Fibonacci extensions or level $2,969.56.
Ethereum Indicator Analysis
ETH/USD is at level 46 of the Relative Strength Index period 14. The altcoin is in the downtrend zone and below the centerline 50. The implication is that the altcoin is capable of falling in the downtrend zone. Ether has fallen below the 20% range of the daily stochastic. It indicates that the market has reached the oversold region of the market. Buyers are expected to emerge in the oversold region.

Technical indicators:
Major Resistance Levels – $2, 600, $2,800, $3,000
Major Support Levels – $1.500, $1, 300, $1,100
What Is the Next Direction for Ethereum?
Today, Ethereum has fallen to the previous low. The altcoin has reached bearish exhaustion. The price indicator has shown that Ether has fallen into the oversold region. This implies that further selling is unlikely on the downside. Meanwhile, on July 5 downtrend; a retraced candle body tested the 61.8% Fibonacci retracement level. The retracement indicates that ETH is likely to fall to level 1.618 Fibonacci extension or level $2,157.98. Ethereum has ended its downward move. The price action has tested the Fibonacci level and it is resuming upward.

You can purchase crypto coins here. Buy Token
Note: new.cryptosignals.org is not a financial advisor. Do your research before investing your funds in any financial asset or presented product or event. We are not responsible for your investing result