Bitcoin (BTC/USD) Fluctuates Around $40,000 Level
Estimated Reading Time: 3 minutes
Don’t invest unless you’re prepared to lose all the money you invest. This is a high-risk investment and you are unlikely to be protected if something goes wrong. Take 2 minutes to learn more
Bitcoin Price Prediction – June 16
It is recorded on the financial record book of Bitcoin versus the US Dollar again sees fluctuates around the $40,000 level. As of writing, price trades at the value of $38,847 at a percentage rate of about -2.92.
BTC/USD Market
Key Levels:
Resistance levels: $45,000, $55,000, $60,000
Support levels: $35,000, $30,000, $25,000
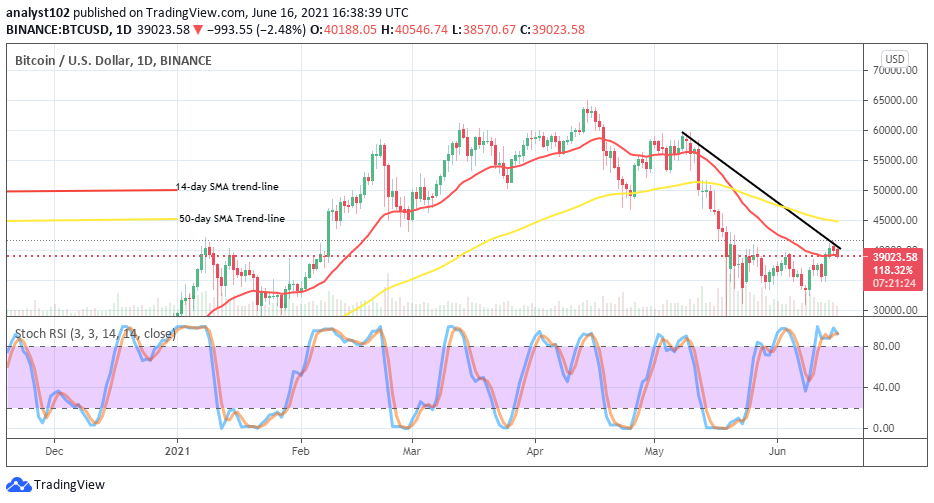
BTC/USD – Daily Chart
The BTC/USD daily chart has depicted that most of the ups and downs in the smaller pace of moving have been featuring around the market level of $40,000. As the smaller SMA has breached to the north, the crypto economy is now expected to gradually set on a journey to the upside. But, for the fact that price still fluctuates in the market, there may be some degrees of a downswing. The 50-day SMA is located above the 14-day SMA as the bearish trend-line remained drawn across the bigger indicator placing a mark on today’s candlestick in the making. The Stochastic Oscillators are in the overbought region seemingly consolidating.
Will the BTC/USD market succeed trading past the 440,000 level in the near time?
The market level of $40,000 appears yet not being far from getting reversal movement in the wake of some upward moves that have featured recently. In the meantime, the emergence of a bullish candlestick on June 13 that formed against the smaller SMA trend-line has indicated that the BTC/USD bulls have to beef upon in their subsequent repositioning in this crypto operation.
As regards the downside of this market, a test of the bearish trend-line is necessary to signal a reversal against the smaller SMA trend-line to suggest a return of downward move. On the contrary, break out of the trend-line could bring about touching the immediate resistance level of $45,000. In other words, bears are enjoined to always be wary of their entries at this level of trading.
BTC/USD 4-hour Chart
The BTC/USD medium-term chart reveals that the crypto has embarked upon a relatively increase as there has been the formation of bullish channels indicating the range path within which price has been pushing. The market has initially reverted from a higher point to now touch the smaller SMA trend-line for support around the buy signal to be able to make a pull-up as the 50-day SMA indicator is located underneath at close range. The Stochastic Oscillators are dipped into the oversold region with crossed lines. That could in the near time lead to seeing a rebound soon in the market.
Note: new.cryptosignals.org is not a financial advisor. Do your research before investing your funds in any financial asset or presented product or event. We are not responsible for your investing results.