Ethereum (ETH/USD) Keeps Stance at a Lower Range-line
Estimated Reading Time: 3 minutes
Don’t invest unless you’re prepared to lose all the money you invest. This is a high-risk investment and you are unlikely to be protected if something goes wrong. Take 2 minutes to learn more
Ethereum Price Prediction – June 14
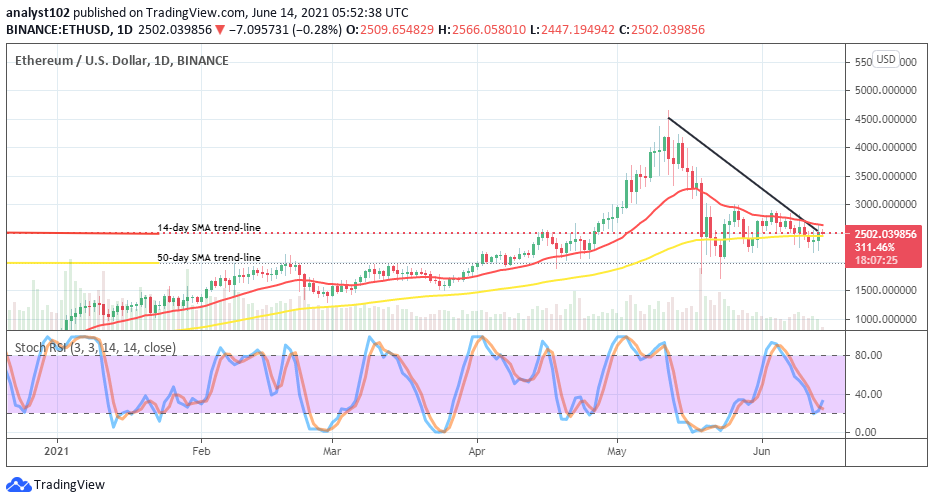
The market worth featuring between Ethereum and the US Dollar keeps stance around the lower range-line of $2,500. Price is trading around $2,506 at a negative percentage rate of about -0.10.
ETH/USD Market
Key Levels:
Resistance levels: $3,000, $3,500, $4,000
Support levels: $2,000, $1,800, $1,600
ETH/USD – Daily Char
There has been a continued appearance of the bigger SMA around the kind of trading stance that Ethereum keeps pairing with the US Dolar overly to showcase the degree of ranging move on the daily chart. The 14-day SMA trend-line remains intently situated above the 50-day SMA indicator as they both point toward the east direction signaling an ongoing price-ranging movement. The bearish trend-line drew across the smaller SMA from the top to closely locate a tight position of trade near the bigger SMA. The Stochastic Oscillators have moved downward to attempt to cross the lines between ranges of 40 and 20 back upward to suggest a return of an upswing.
Is the downward range moving coming to an end in the ETH/USD market operations?
At this point, it is closely observed that the market operations between Ethereum and the US Dollar are now intently featuring around the lower range-line of $2,500 for quite a while. And, some of the downward moves recently underneath that level have been considered being supports gaining zone that bulls are expected to exert their positions. Therefore, a spike seems possible around the value earlier mentioned.
Likewise, at this point, bears needed to be wary of launching further positions around the lower range level to avoid any possibility of being whipsawed in no time. As result, the crypto market may now be allowed to make a run to the upside the way price action may eventually force it as the northbound crossing of lines of the Stochastic Oscillators has signaled.
ETH/BTC Price Analysis
In comparison, it is depicted on the ETH/BTC price analysis that the trending capacity of the base crypto has only been reverted to a kind of correctional movement pairing with the flagship counter crypto. The 14-day SMA has very thinly bent over the bullish trend-line pointing toward the east to indicate a short line of range moves as the 50-day SMA indicator is located below them pointing toward the north. The stochastic Oscillators are in the oversold region to suggest a near probability of getting to see Ethereum is on the verge of regaining its momentum as being placed with Bitcoin.
Note: new.cryptosignals.org is not a financial advisor. Do your research before investing your funds in any financial asset or presented product or event. We are not responsible for your investing results.