Ethereum (ETH/USD) Market Consolidates at a Higher Point
Estimated Reading Time: 3 minutes
Don’t invest unless you’re prepared to lose all the money you invest. This is a high-risk investment and you are unlikely to be protected if something goes wrong. Take 2 minutes to learn more
Ethereum Price Prediction – July 28
Presently, the ETH/USD market consolidates at a higher point, trading a bit above the level of $23,000. The crypto’s valuation trades at a lower percentage increase of 0.73 as of writing.
ETH/USD Market
Key Levels:
Resistance levels: $2,500, $3,000, $3,500
Support levels: $2,000, $1,750, $1,500
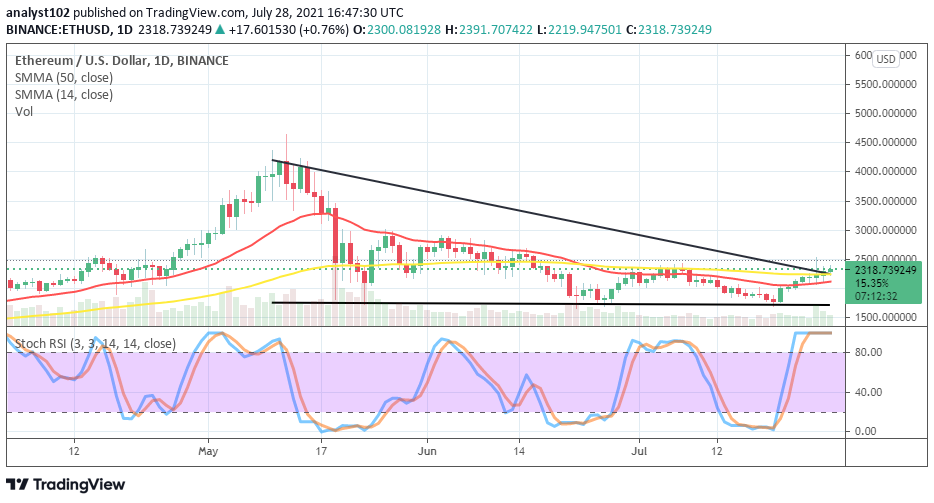
ETH/USD – Daily Chart
The ETH/USD daily chart depicts that the crypto market consolidates at a higher point as some of the indicators have breached northward. During the July 26th trading session, the crypto’s price hit resistance at the level of $2,500. A smaller bullish candlestick is in the making above the trading indicators. The 50-day SMA is above the 14-day SMA as the bullish trend-line drew downward to mark the point that the bigger SMA has slightly breached to the north. The Stochastic Oscillators are in the overbought region with conjoined lines, signaling that the crypto market is moving in a consolidation manner.
Will the level at $2,500 breach later on as the ETH/USD market consolidates at a higher point?
There may be a retest around the level at $2,500 as the ETH/USD market consolidates at a higher point if bulls hold on strong between $2,300 and $2,500. The eventual interception of the bigger SMA trend-line from below by the 14-day SMA trend-line may signal trading over the point earlier mentioned, possibly in a serial northward moving arrangement. However, a sudden rejection at that level may give way to a downward motion.
On the downside, two valuable points between $2,300 and $2,500 are in focus right now, suggest that the ETH/USD market bears needed to be at alert, spotting a price motion rejecting in those lines before considering joining. A forceful break out devoid of reversal at the immediate resistance line will decimate the possibility of getting a sell entry during a volatile motion. The use profit trailing is recommended while in profit.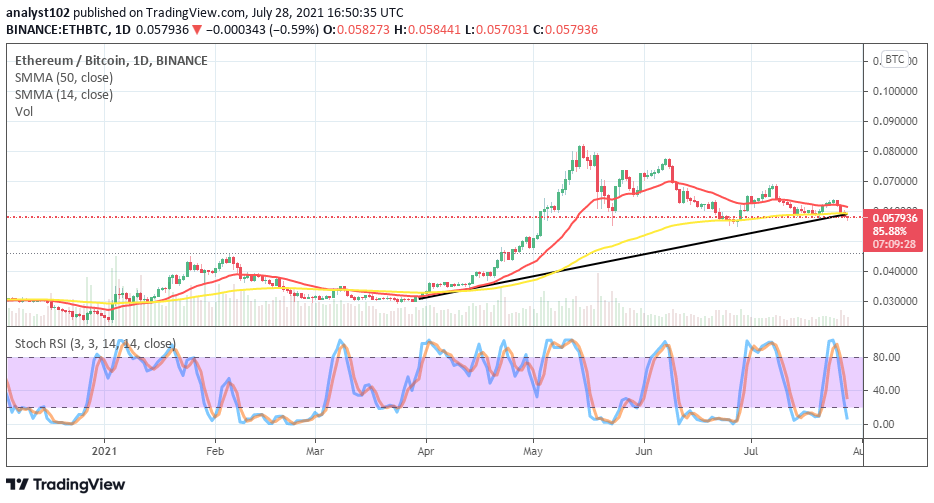
ETH/BTC Price Analysis
On the ETH/BTC price analysis chart, the base crypto market consolidates slightly around a higher point. The 14-day SMA trend-line is above the 50-day SMA trend-line to denote that the base crypto still somewhat has the better chance trend against the most expensive counter crypto in the near session. The Stochastic Oscillators are now freshly in the oversold region, suggesting a probable regaining of momentum by ETH compared with BTC at a later session.
Note: Cryptosignals.org is not a financial advisor. Do your research before investing your funds in any financial asset or presented product or event. We are not responsible for your investing results.
You can purchase crypto coins here. Buy Tokens