Ethereum (ETH/USD) Market Features at $4,000
Estimated Reading Time: 3 minutes
Don’t invest unless you’re prepared to lose all the money you invest. This is a high-risk investment and you are unlikely to be protected if something goes wrong. Take 2 minutes to learn more
Ethereum Price Prediction – December 13
It is still closely observed that the ETH/USD market features at $4,000 as there have been variant northward pushes and southward pushes against the value-line over a couple of sessions. The crypto-economic valuation trades around $4,022 at a negative percentage rate of about 2.68.
ETH/USD Market
Key Levels:
Resistance levels: $4,250, $4,500, $4,750
Support levels: $3,750, $3,500, $3,250
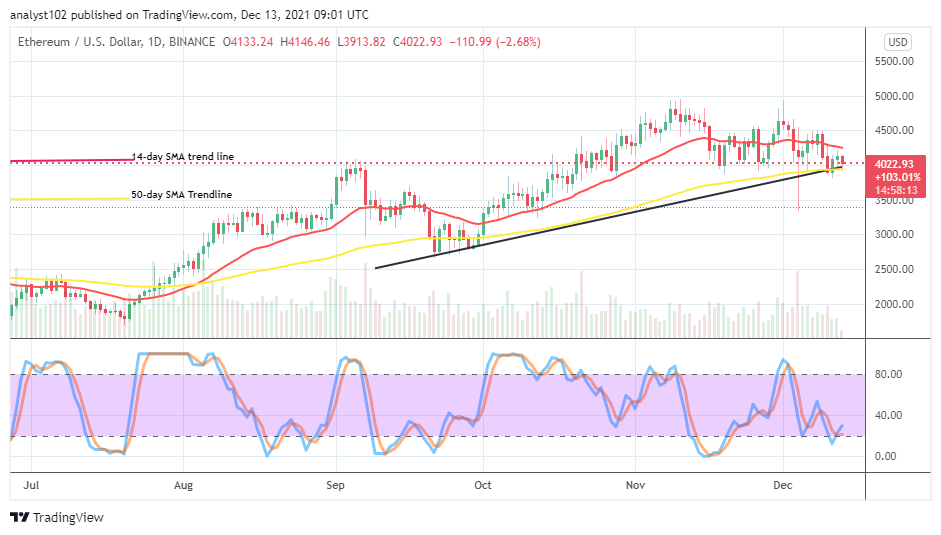
ETH/USD – Daily Chart
The ETH/USD daily chart showcases that the crypto market features at $4,000 trading levels characterized by ups and downs around the point. The candlesticks representing the downs in the market appear, trying to symbolize a pattern that suggests that price has been trying to find support around the value-line mentioned over time. The 14-day SMA trend line is above the 50-day SMA trend line, slightly pointing toward the east. The Stochastic Oscillators are positioned around range 20, attempting to cross the lines northbound to signify the possibility of achieving a degree of ups more preferably at the expense of the US Dollar.
Will there still be a continued trading situation of getting ups and downs as the ETH/USD market features at $4,000?
Likely, the trading situation warranting seeing a continued condition of getting ups and downs will persist until a while as the ETH/USD market features at $4,000. More importantly, long-position takers of this trade needed to allow an amount of depression staging against the value line and, later regaining, a rebounding posture before considering a buy position entry in the process afterward.
On the downside of the technical analysis, the ETH/USD market short-position takers should have to consolidate their stances around the $4,000 to hold firmly against some of the up swinging motions been attempting in the crypto business activities. However, it is still technically inclined that price won’t survive downing-trading moment underneath the value line.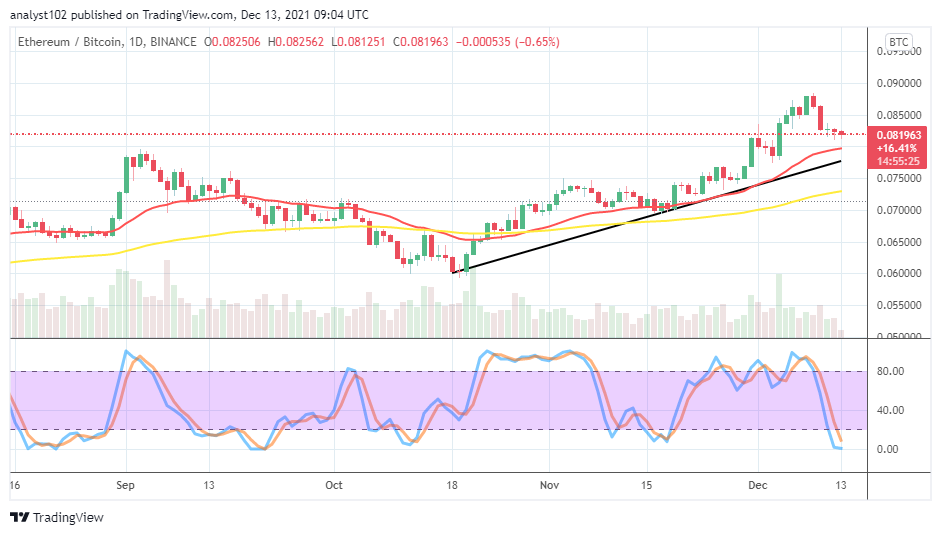
ETH/BTC Price Analysis
In comparison, Ethereum’s trending capability still indicates an overwhelming condition as paired with Bitcoin despite the current formation of many bearish candlesticks. The cryptocurrency pair market features above the trend lines of the SMAs. The 14-day SMA indicator is above the 50-day SMA indicator. The bullish trend line drew beneath the smaller SMA trend line, playing a supportive role. The Stochastic Oscillators have dipped into the oversold region close to the range of zero. That indicates that the base crypto may have been lesser-pushed to a lower-high trading spot. If the situation ends been forcing the pair into a consolidation, the counter crypto may, in the long run, add more catalyst to push against the base crypto.
Note: Cryptosignals.org is not a financial advisor. Do your research before investing your funds in any financial asset or presented product or event. We are not responsible for your investing results.
You can purchase crypto coins here. Buy Tokens