Ethereum (ETH/USD) Market Keeps Position High
Estimated Reading Time: 3 minutes
Don’t invest unless you’re prepared to lose all the money you invest. This is a high-risk investment and you are unlikely to be protected if something goes wrong. Take 2 minutes to learn more
Ethereum Price Prediction – August 16
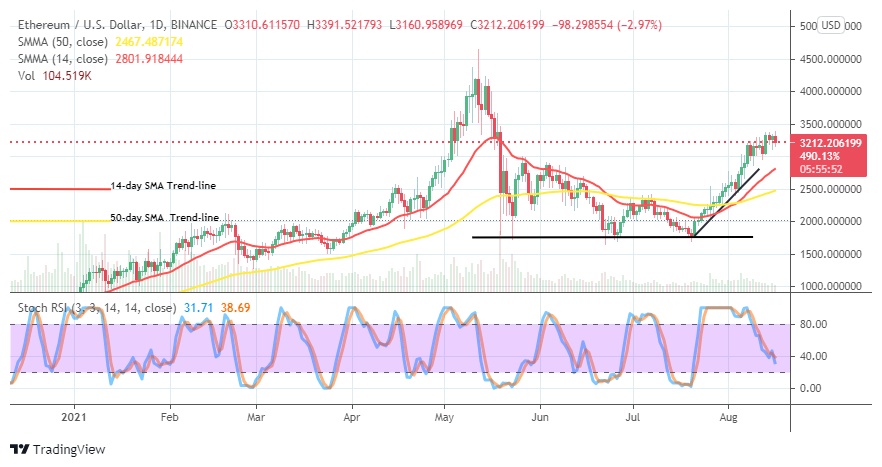
The ETH/USD market keeps its position high close underneath the resistance line at $3,500. The crypto economy records a percentage rate of -2.97 to trade around the point of $3,212.
ETH/USD Market
Key Levels:
Resistance levels: $3,500, $3,750, $4,000
Support levels: $3,000, $2,750, $2,500
ETH/USD – Daily Chart
The ETH/USD chart shows the market keeps its position high above the level of $3,000. The 50-day SMA trend-line remains intercepted northward by the 14-day SMA trend-line. The Stochastic Oscillators have slowly bent southbound to place a bit past the range of 40. Yet, the reading of the tool suggests that some degrees of lower values may come on.
Will the crypto’s price change direction soon as the market keeps its position high?
It may not be easy to determine the next actual direction of the crypto trade as the ETH/USD market keeps its position high. The 14-day SMA indicator is striving to extend the trend-line toward the $3,000. Price may be pushing down around the point so that bulls can re-build their stance in the market. A fake pull-down below it will let upward motion set in.
On the downside, the downward force of the market seems not strong as signaled by the Stochastic Oscillators. The ETH/USD market bears may have to re-muster energy around the immediate resistance at $3,500. It appears that price convergences around the levels of $3,000 and $3,500. If that trading situation prolongs, the crypto’s valuation may continue to feature in ranges.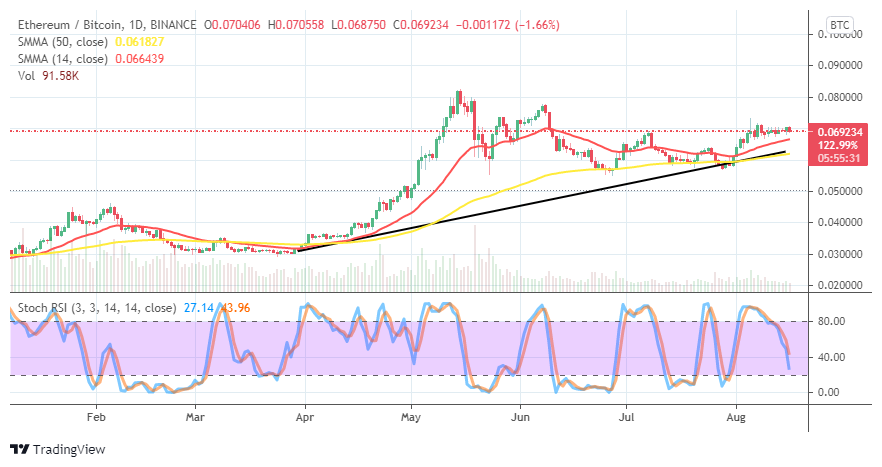
ETH/BTC Price Analysis
The trending capacity between ETH and BTC shows that the base crypto market keeps its position high against the counter crypto. The 50-day SMA trend-line is closely alongside the bullish trend-line below the 14-day SMA trend-line. The Stochastic Oscillators have crossed southbound briefly past the range 40. That indicates that the base crypto tends not to lose trending weight to the counter crypto in the next session.
Note: Cryptosignals.org is not a financial advisor. Do your research before investing your funds in any financial asset or presented product or event. We are not responsible for your investing results.
You can purchase crypto coins here. Buy Tokens