Ethereum (ETH/USD) Market Ranges in $3,000 and $3,500
Estimated Reading Time: 3 minutes
Don’t invest unless you’re prepared to lose all the money you invest. This is a high-risk investment and you are unlikely to be protected if something goes wrong. Take 2 minutes to learn more
Ethereum Price Prediction – August 30
There have been continual variant market ranges in $3,000 and $3,500 of the trading operations between Ethereum and the US Dollar. The crypto economy makes a record of a negative percentage rate of about 1.30 to trade at the level of $3,183. That gives a reading of the market as slightly moving southward to the lower range value.
ETH/USD Market
Key Levels:
Resistance levels: $3,500, $3,750, $4,000
Support levels: $3,000, $2,750, $2,500
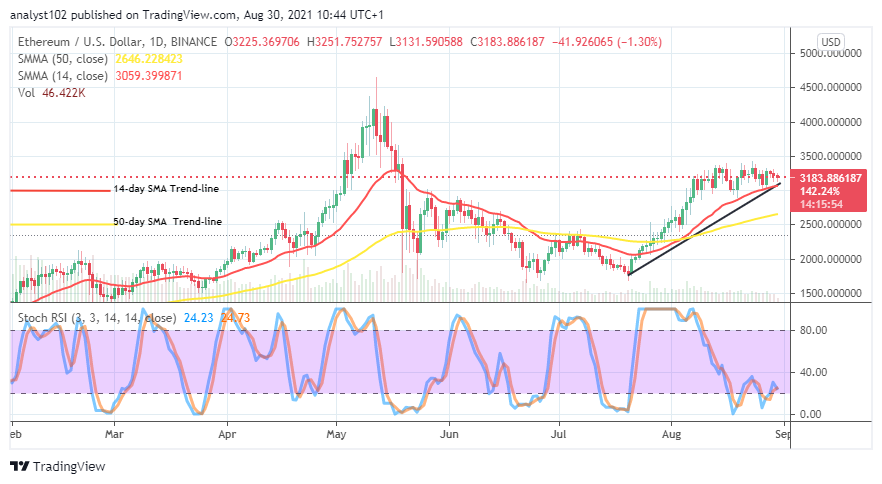
ETH/USD – Daily Chart
The ETH/USD daily chart showcases that the crypto market ranges in $3,000 and $3,500 over several trading days’ sessions until writing today. The 14-day SMA indicator has moved briefly past the $3,000 as the bullish trend-line drew closely beneath it to conjoin at the extreme point near below the current trading price of the market. The 50-day SMA indicator keeps a distanced space below them a bit over $2,500. The Stochastic Oscillators wage a kind of erratic consolidation movement between the ranges of 40 and 0.
The ETH/USD market ranges in $3,000 and $3,500, will price breach southward at the lower range line?
Currently, there has been no substantial factor to signify a change of price direction as the ETH/USD market ranges in $3,000 and $3,500 lines until the present. In the meantime, bulls possess the possibility of regaining and pushing northward from the lower range line if no forceful pressure is against the value. A powerful southward movement at the level may potentially lead to creating a long-legged bullish candlestick to give way to better up strides.
On the downside analysis, it seems that lower supports have been strongly built beneath the level of $3,000 as the ETH/USD market bears find it hard to have pushed back downward past. As a result, many downward movements of the crypto trade may not be forthcoming at later sessions. Quick price rebounding motion is likely to be coming up while the market tends to make slight downward moves around the point mentioned earlier.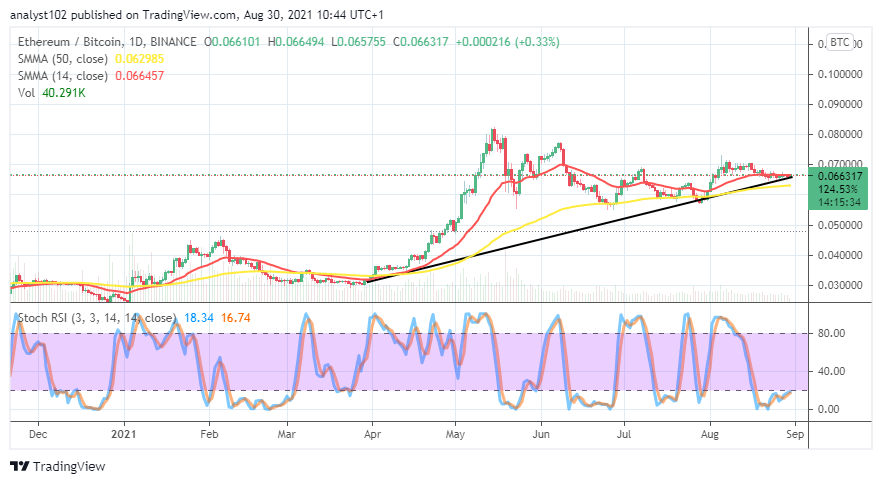
ETH/BTC Price Analysis
In comparison, the trending outfit of Ethereum with that of Bitcoin, the daily price analysis chart depicts that the duo-cryptos market ranges around the trend-line of the smaller SMA. The 50-day SMA trend-line is a bit underneath the 14-day SMA trend-line as the bullish trend-line drew northward to support the smaller SMA. The Stochastic Oscillators have dipped into the oversold region with the lines conjoined to erratically move northbound in a much less active motion to touch the range at 20. That signifies that the base crypto is preparing to swing as placed with counter crypto.
Note: Cryptosignals.org is not a financial advisor. Do your research before investing your funds in any financial asset or presented product or event. We are not responsible for your investing results.
You can purchase crypto coins here. Buy Tokens