Ethereum (ETH/USD) Price Convergences in $3,000 and $3,500
Estimated Reading Time: 3 minutes
Don’t invest unless you’re prepared to lose all the money you invest. This is a high-risk investment and you are unlikely to be protected if something goes wrong. Take 2 minutes to learn more
Ethereum Price Prediction – August 23
The ETH/USD price convergences in $3,000 and $3,500 lines as the crypto’s price trades around $3,326. The percentage rate of the market activities is at 2.66 as of writing. It shows that the upward pressure is still holding positively to some extent.
ETH/USD Market
Key Levels:
Resistance levels: $3,500, $3,750, $4,000
Support levels: $3,000, $2,750, $2,500
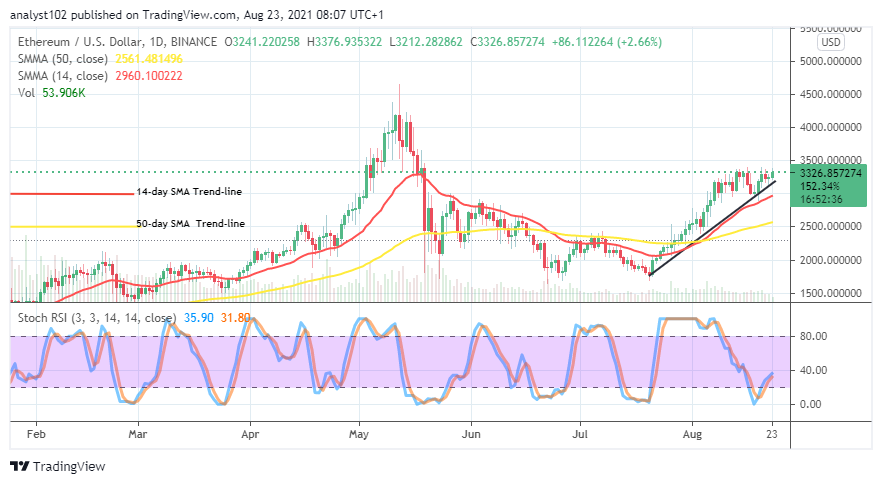
ETH/USD – Daily Chart
Trading lines of $3,000 and $3,500 on the ETH/USD daily chart show that the crypto’s price convergences in those values. The 50-day SMA trend-line is around $2,500 beneath the 14-day SMA trend-line. The smaller SMA indicator trends closely alongside the bullish trend-line drew near below the current candlestick formed at a higher trading zone. The Stochastic Oscillators have somewhat crossed the lines northbound from the oversold region. They now seemingly are attempting to curve back downward near beneath the range of 40. That signifies that the market may soon witness a downward motion in no time.
As the ETH/USD price convergences in $3,000 and $3,500, will it be prolonged further?
Trading points at $3,000 and $3,500 have to be the zones that variant ups and downs have continually featuring. In other words, they are the trading areas that the ETH/USD price convergences over a couple of sessions until the present. It now appears that the bulls’ strength is getting toward resistance around $3,500. Therefore, a sudden further push around is most liable to carry a reversal motion in a moment. As a result, longing for more position on this crypto market’s trading capacity needed to reconsider a second technical thought.
On the downside, the market’s weighing indicator has positioned southward slightly to portend the possibility of seeing the ETH/USD operation going down in no time. Therefore, bears needed to be on the lookout for a decent sell entry to launch a position. The line around $3,500 appears to be the most reliable zone that a suitable resistant trading situation will occur.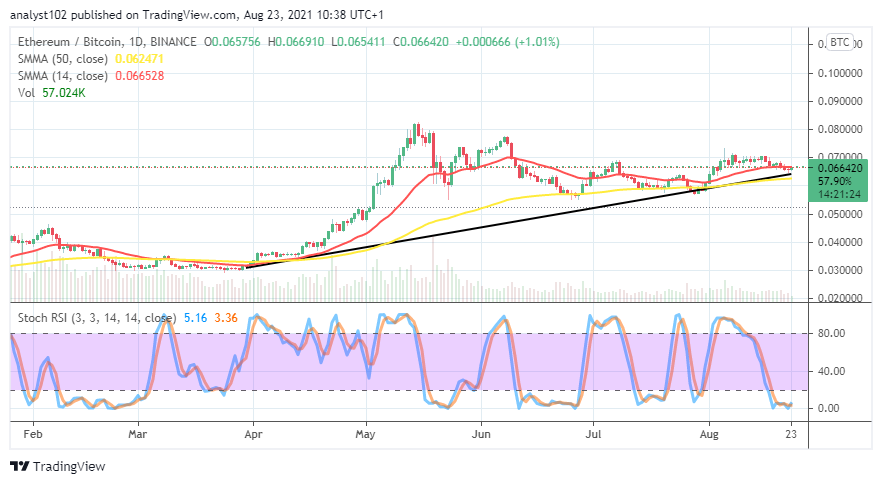
ETH/BTC Price Analysis
In comparison, Ethereum’s trending capacity with Bitcoin’s appears to be moving in a retracement pattern as price convergences at a higher trading level. The 14-day SMA indicator is closely above the 50-day SMA indicator. The bullish trend-line drew alongside the bigger SMA. The Stochastic Oscillators are in the oversold region with conjoined lines, attempting to continue moving in a consolidation manner. That means that the counter crypto would have to hold firm to bring the trend down further against the base crypto. On the contrary, the base crypto may in the long regain the momentum against the flagship counter crypto.
Note: Cryptosignals.org is not a financial advisor. Do your research before investing your funds in any financial asset or presented product or event. We are not responsible for your investing results.
You can purchase crypto coins here. Buy Tokens