Ethereum (ETH/USD) Price Is Hovering Closely Above $1,000
Estimated Reading Time: 3 minutes
Don’t invest unless you’re prepared to lose all the money you invest. This is a high-risk investment and you are unlikely to be protected if something goes wrong. Take 2 minutes to learn more

Free Crypto Signals Channel
Ethereum Price Prediction – July 4
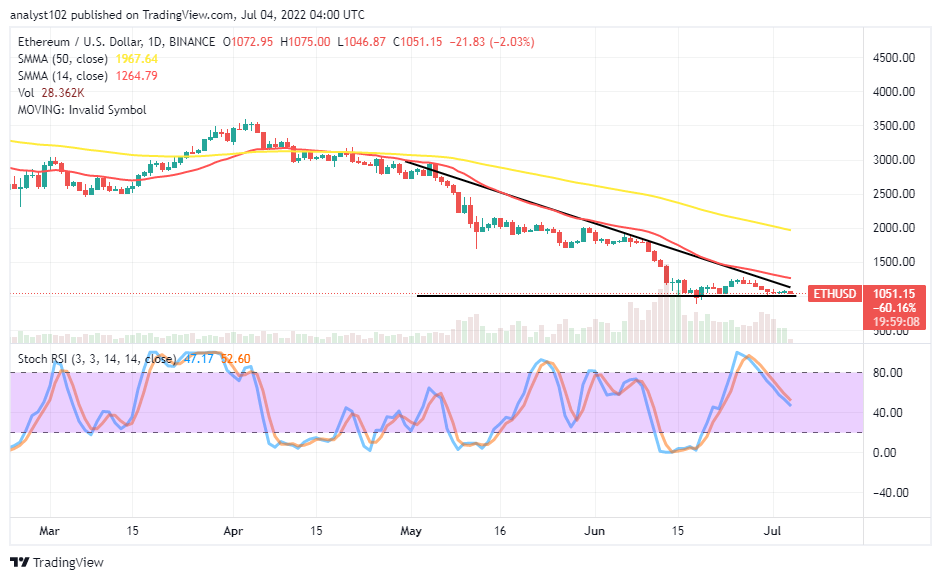
The ETH/USD market price is hovering closely above the $1,000 support trading line as there has still been a declining outlook in the operations. Price possesses a negative percentage rate of 2,03, trading around the $1,051 spot as of writing.
ETH/USD Market
Key Levels:
Resistance levels: $1,250, $1,500, $1,750
Support levels: $1,000, $800, $600
ETH/USD – Daily Chart
The ETH/USD daily chart shows the crypto-economic price is hovering closely above the $1,000 support level as the SMAs are above the current trading spot. The 14-day SMA indicator is underneath the 50-day SMA indicator. The Stochastic Oscillators are somewhat positioned slantingly from the overbought region close to the 40 range. To a reasonable extent, some downs are to feature, possibly around the support value-line mentioned earlier.
Can there be a change in the ETH/USD market’s trend soon?
The pace of observing a change in the trend of any pairing of trading instruments largely depends on the actions of the two major movers. Therefore, as the ETH/USD market price is hovering closely above $1,000, an indicator suggests there has not been a definite direction presently. And based on that, traders may stay off from launching new positions until a clearer signal generates. Long-position takers need to let some pull-downs occur to couple with rebounding signs before going for buying order.
On the downside of the technical analysis, the horizontal line drawn at the $1,000 psychological level will have to breach fearfully to set the bearish-trading pace under a new resistance level this year. The positioning of the Stochastic Oscillators indicates that that assumption may be forthcoming on a slow-and-steady moving mode if the ETH/USD market bulls are not bracing up catalyst around the value line in the near time.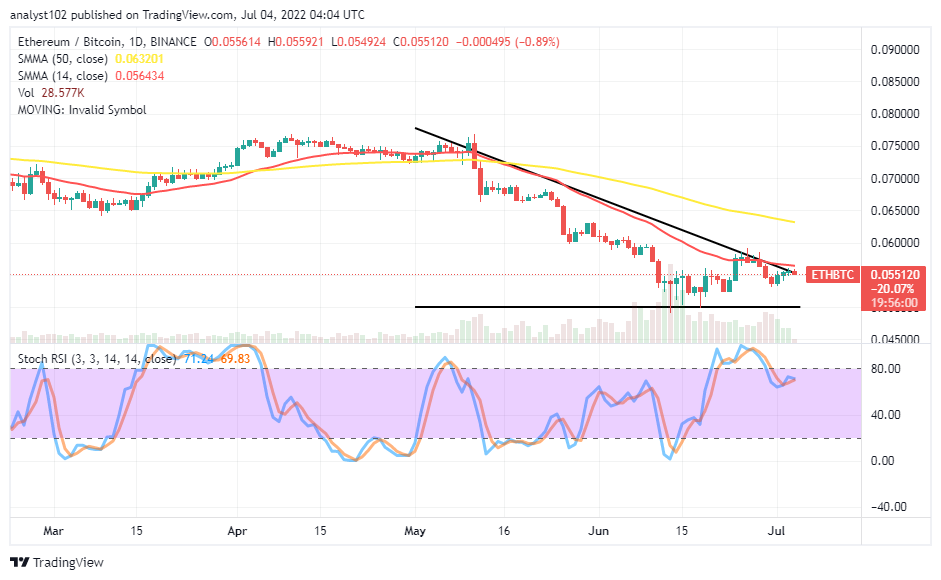
ETH/BTC Price Analysis
Ethereum’s market trending force has been hovering closely around the trend line of the smaller SMA compared with that of Bitcoin. The 14-day SMA indicator is underneath the 50-day SMA indicator. The horizontal line drew a bit far below the smaller SMA trend line. The Stochastic Oscillators have slightly crossed northbound from the overbought region to denote that the situation portends the possibility of the base crypto running into a declining motion soon against its counter-trading crypto.
Note: Cryptosignals.org is not a financial advisor. Do your research before investing your funds in any financial asset or presented product or event. We are not responsible for your investing results.
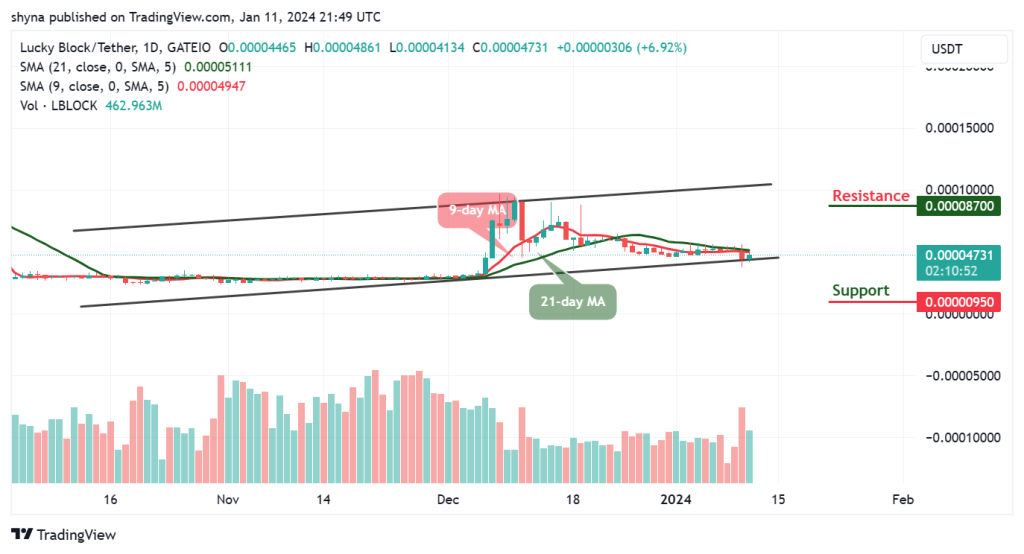
“Lucky is up more than 50% today but still more than 430% from All Time Highs!
The opportunity to bank BIG is now!
You can purchase Lucky Block here. Buy LBlock