Litecoin (LTC/USD) Beefs up Rallies
Don’t invest unless you’re prepared to lose all the money you invest. This is a high-risk investment and you are unlikely to be protected if something goes wrong. Take 2 minutes to learn more
Litecoin Price Prediction – June 29
The LTC/USD trade activity currently beefs up rallying from the depth of the lower trading zone close to the $100 support level. The crypto’s price trades around the value of $148 at a rate of about 7.89 percentages.
LTC/USD Market
Key Levels:
Resistance levels: $180, $230, $280
Support levels: $120, $100, $80
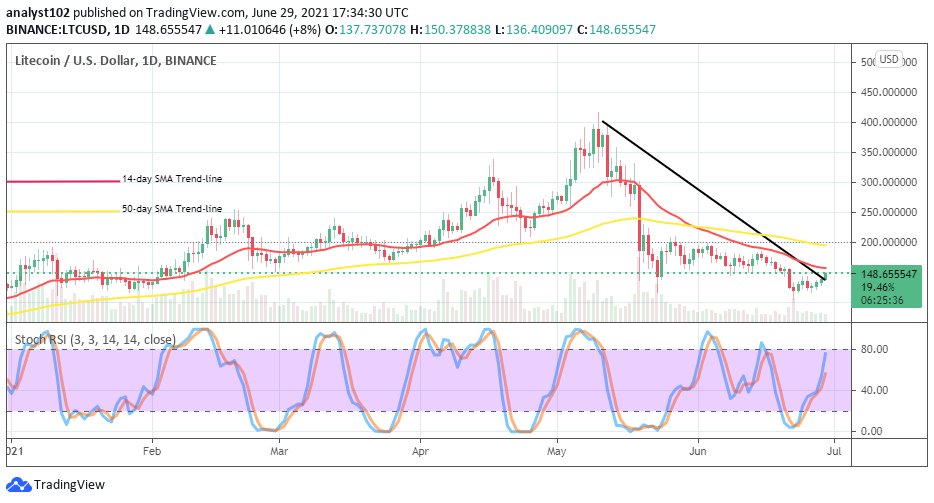
LTC/USD – Daily Chart
The LTC/USD daily chart depicts that the crypto now strives to beef up its rallying movement towards the point of $150. The bearish trend-line has breached slightly upward as the smaller SMA is below. The 50-day SMA indicator is above the 14-day SMA trend-line. The Stochastic Oscillators have closely moved northbound toward range 80. That suggests that a line of upward pressure is ongoing in the crypto market presently.
Would there be a breakout at the level of $150 soon?
The market level of $150 is on the verge of breaching northward. However, bulls may be taking their time to launch positions at that level as well. From the technical viewing point, that level is the zone that conforms to the present bearish pathway of the current bearish trend. The market’s failure to push northward further at that point may lead to letting price reverts into a downturn movement again.
On the downside, as mentioned in the preceding paragraph, the market level at $150 will have to put in the limelight of trading. There may be a pit stop around the point as well. A line of consolidation movements cannot erase in this crypto economy as the stochastic Oscillators have reached one of the topmost range levels. Al sudden hike against the smaller SMA will most likely put the market on the trackback to the north side.
LTC/BTC Price Analysis
Litecoin as the base crypto has relatively embarked upon pushing against the trending capability of Bitcoin as the counter trading instrument in comparison. The trading indicators portend a better promising moving outlook for the base tool as a chain of lower highs on the LTC/BTC price analysis. The 14-day SMA has crossed the 50-day SMA southwardly. The Stochastic Oscillators are at a range of 80, pointing to the north. Either a recessive trading situation or a reversion is looming.
Note: new.cryptosignals.org is not a financial advisor. Do your research before investing your funds in any financial asset or presented product or event. We are not responsible for your investing results.
You can purchase crypto coins here. Buy Tokens