Bitcoin (BTC/USD) Market Features a Descending Triangular Pattern
Estimated Reading Time: 3 minutes
Don’t invest unless you’re prepared to lose all the money you invest. This is a high-risk investment and you are unlikely to be protected if something goes wrong. Take 2 minutes to learn more

Free Crypto Signals Channel
Bitcoin Price Prediction – February 9
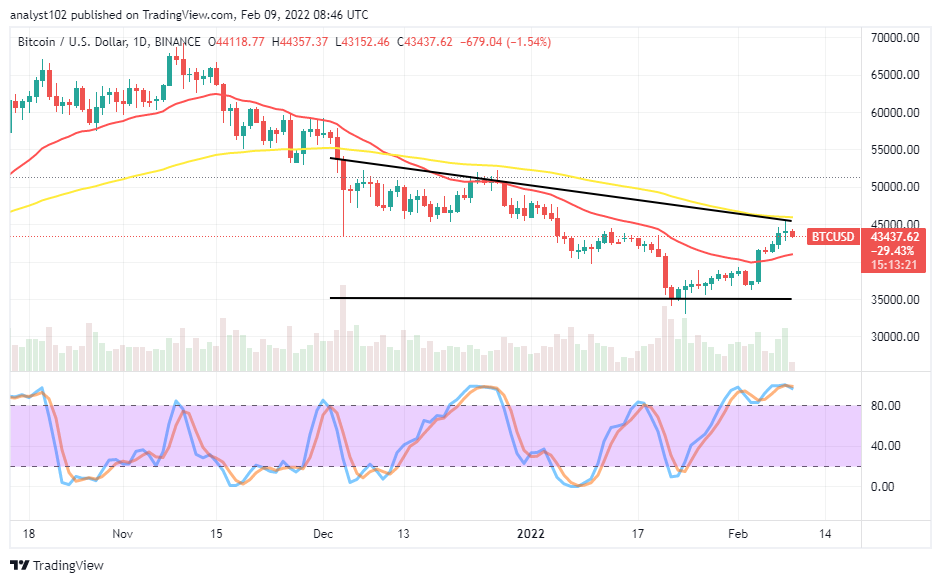
After a line of successive rebounding motions in the BTC/USD trade activities, the crypto-economic market currently features a descending triangular pattern to denote a brighter chance of getting variant sell signals in the subsequent sessions, usually around a higher resistance trading spot. Today’s trading session has witnessed a high and a low of $44,357 and $43,152 at a percentage of 1.54 negatives.
BTC/USD Market
Key Levels:
Resistance levels: $45,000, $47,500, $50,000
Support levels: $42,500, $40,000, $37,500
BTC/USD – Daily Chart
The BTC/USD daily chart reveals the crypto market operation features a descending triangular trading pattern after it couldn’t sustainably surge above the $45,000 resistance level. The bearish trend line drew southward to conform alongside the bigger SMA at the extreme trending end. The 50-day SMA indicator is above the 14-day SMA indicator. The Stochastic Oscillators are in the overbought region, seemingly attempting to rebate northward consolidation moving motion within. That signifies the profanity of a re-occurrence of falling forces in the near session.
Are there still indications backing a return of downward trend in the BTC/USD trade operations as the crypto market features a descending triangular pattern?
The current indications backing a return of downward trend in the BTC/USD trade operations are now on a fresh compiling note at a higher trading spot as the market features a descending triangular pattern. Long-positioning orders may now have to suspend for a while. Price tends to face a firm resistance trading situation as indicated by the reading of the 50-day SMA at the $45,000 in the long-term run of the market.
On the downside of the technical analysis, the BTC/USD market short-position takers have to be cautious of exerting positions, especially when no active reversal motion is spotted. The exertion of sell orders may have to focus around $45,000 or, between it and the $47,500. A loss of momentum in a consolidation moving style of the market will result in a free-fall sooner than later.
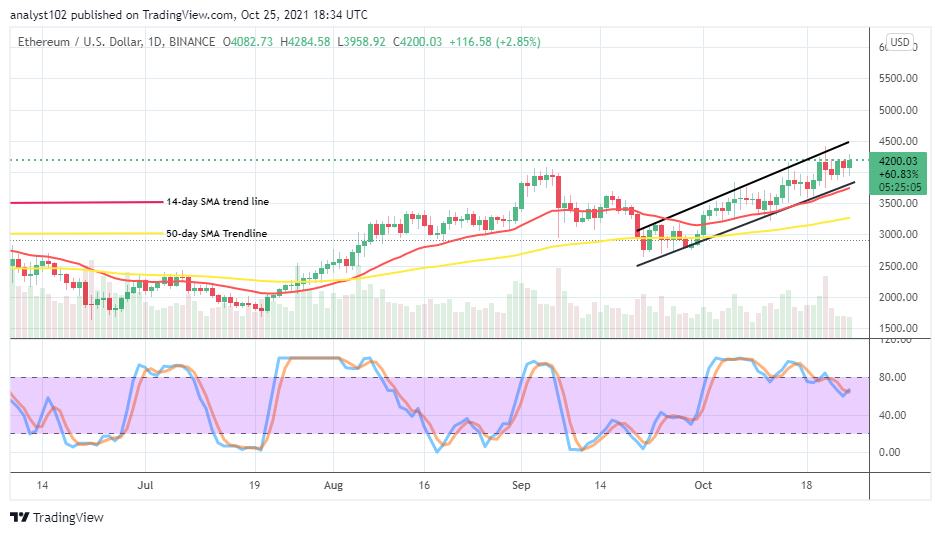
BTC/USD 4-hour Chart
The BTC/USD 4-hour chart shows bullish trend lines, indicating a recovery motion against the daily chart, which showcases a descending triangular pattern. The 50-day SMA trend line is underneath the 14-day SMA trend line within the rebounding channel trend lines. The Stochastic Oscillators are in the oversold region, moving in a consolidation manner. An upward force may soon return toward the resistance level of around $45,000. A degree of patience is still needed to exercise by short-position takers for a while until an active reversal motion occurs at a higher trading zone before considering a shorting order.
Note: Cryptosignals.org is not a financial advisor. Do your research before investing your funds in any financial asset or presented product or event. We are not responsible for your investing results.
You can purchase crypto coins here. Buy Tokens