Litecoin (LTC/USD) Keeps Range-Bound Outlook
Estimated Reading Time: 3 minutes
Don’t invest unless you’re prepared to lose all the money you invest. This is a high-risk investment and you are unlikely to be protected if something goes wrong. Take 2 minutes to learn more
Litecoin Price Prediction – June 15
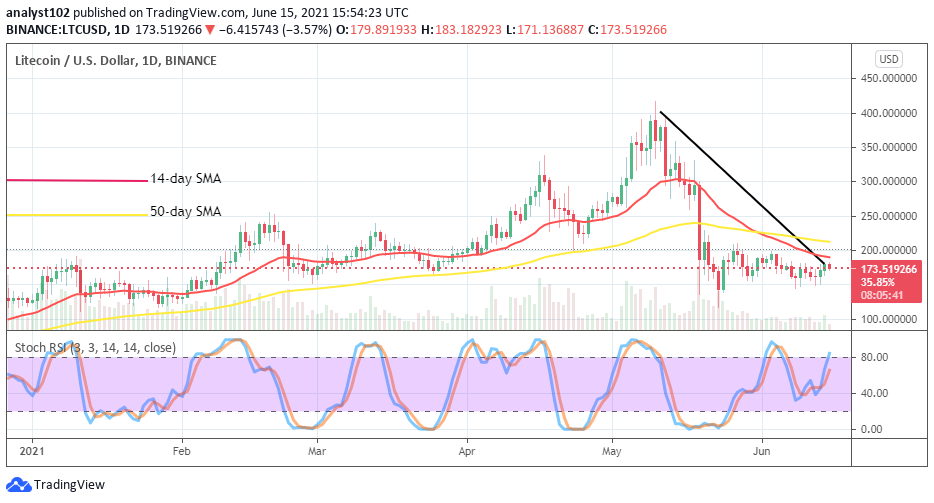
There have been many attempts of failed break out or down away from the current range-bound outlook that the LTC/USD market keeps now over variant sessions until the present. Price still trades in the ranges of $200 and $150 at the level of around $174 to record a negative percentage rate of about -3.16 as of writing.
LTC/USD Market
Key Levels:
Resistance levels: $200, $250, $300
Support levels: $150, $130, $110
LTC/USD – Daily Chart
The formation of lower highs on the LTC/USD daily chart in the range-bound levels of $200 and $150 currently appears to have hit a resistance point as well. Hence, the bearish trend-line drew downward to locate a position at the top of tiny bearish candlestick in the making. The 14-day SMA trend-line is a bit situated over the tiny bearish candlestick as the 50-day SMA indicator is located above it with a small space between them. The Stochastic Oscillators have swerved the lines opened northbound to briefly touch past range 80 into the overbought region. 
Will there still be prolonged range-bound moves in the LTC/USD market?
From most of the indications, it is most likely going to be prolonged range-bound moves in the market activities taking place between Litecoin and the US fiat currency in the next session. In light of that, the $200 immediate resistance level will remain the main upper range zone of the market. Bulls are not expected to gather momentum at that level if the rage-bound trading outlook has to genuinely keep by the crypto traders during the succeeding business transactions..
In continuation of the current range-bound trading outlook, bears on a usual grand have to regain the market momentum around the upper range-bound spot. However, bears are always enjoined to be wary of their newly launched position every time most especially while price tends to be less active in the market around the immediate resistance point. The northbound pointing direction of the Stochastic Oscillators suggests a strong warning as to whether price will be smoothly reversed in the near time.
LTC/BTC Price Analysis
The LTC/BTC price analysis chart indicates that the base crypto is on the verge of losing trending momentum more visibly as the smaller SMA has bent southward to touch the bigger SMA from the top. And, lower variant lows are being formed closely toward the bullish trend-line that drew below the 14-day and the 50-day SMA trend lines. The Stochastic Oscillators lately dipped into the oversold region but have swung across range 20 with closed lines slightly pointing southbound. That suggests that Litecoin may still lose a bit of its trending capacity to the flagship counter instrument.
Note: new.cryptosignals.org is not a financial advisor. Do your research before investing your funds in any financial asset or presented product or event. We are not responsible for your investing results.