Litecoin (LTC/USD) Market Devalues Slightly Further
Estimated Reading Time: 3 minutes
Don’t invest unless you’re prepared to lose all the money you invest. This is a high-risk investment and you are unlikely to be protected if something goes wrong. Take 2 minutes to learn more
Litecoin Price Prediction – September 28
It is currently on the LTC/USD financial record book that the crypto market devalues slightly further as price around $145. The market’s percentage figure is at 0.48. That gives a sign that the trade operation is somewhat daring to swing upward.
LTC/USD Market
Key Levels:
Resistance levels: $180, $220, $260
Support levels: $140, $120, $100
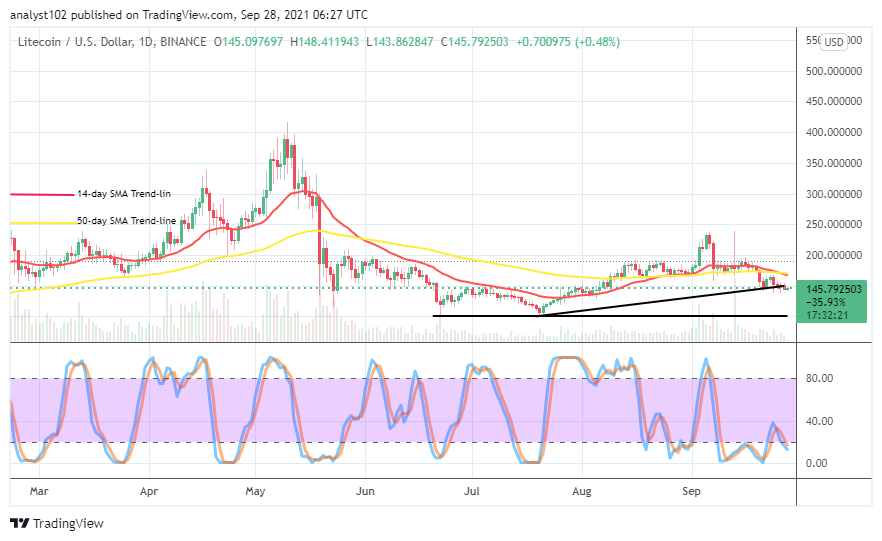
LTC/USD – Daily Chart
The LTC/USD daily chart showcases that the crypto market devalues slightly further as price breaches southward against the $150. The 14-day SMA trend line remains conjoined with the 50-day SMA trend line from the top. Despite the slight southward breaching, the bullish trend line remains drawn northward, placing a supportive mark beneath the SMAs. The Stochastic Oscillators have briefly slanted southbound between the ranges of 40 and 20. That suggests that the current falling force lacks the energy to pose a long holding of price devaluation below the trading capacity.
Will price long-hold hover beneath $150 as the LTC/USD market devalues slightly further off from it?
Long-holding of selling trading position beneath the level of $150 is riskier as the LTC/USD market bulls may, in the near time, muscle up some energy to re-launch their presence. Like wisely, the current situational trading outlook could attract more investors to take advantage to join the market by buying from the dip. The more the price goes down, the better the chance of taking a long position would be.
On the downside, as signaled by the conjoining formation of the SMAs, a resistance trading spot has staged between $150 and $200 so that bears should hold stronger in them. A fearful northward breach against the zone will pave the way to seeing variant ups. Presently, the LTC/USD market bears needed to be very wary of exerting more positions. Analytically, it recommended that shorting of further orders may be put on hold for a while.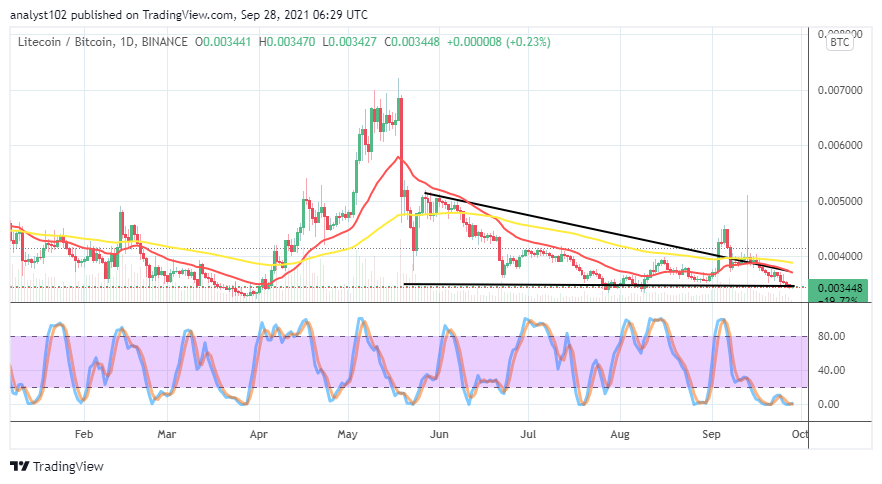
LTC/BTC Price Analysis
The LTC/BTC price analysis chart shows that the crypto pair market devalues slightly further around the critical support baseline drawn over time. In a more explanatory manner, the base crypto is still in the tendency of losing stance as paired with the counter crypto. The 14-day SMA trend line is underneath the 50-day SMA trend line. The Stochastic Oscillators have been consolidating in the oversold region, affirming that Litecoin is yet to stage a come-back as paired with Bitcoin.
Note: Cryptosignals.org is not a financial advisor. Do your research before investing your funds in any financial asset or presented product or event. We are not responsible for your investing results.
You can purchase crypto coins here. Buy Tokens