Litecoin (LTC/USD) Market Fluctuates in a Range Settling
Estimated Reading Time: 3 minutes
Don’t invest unless you’re prepared to lose all the money you invest. This is a high-risk investment and you are unlikely to be protected if something goes wrong. Take 2 minutes to learn more

Free Crypto Signals Channel
Litecoin Price Prediction – May 31
There has been no tangible change in price direction in the LTC/USD trade activities for quite a while as the crypto-economic market fluctuates in a range settling. Currently, the trading position shows price trades at $68 between the high of around $70 and a low of $67, keeping a minute negative percentage rate of 0.85.
LTC/USD Market
Key Levels:
Resistance levels: $75, $100, $125
Support levels: $50, $35, $20
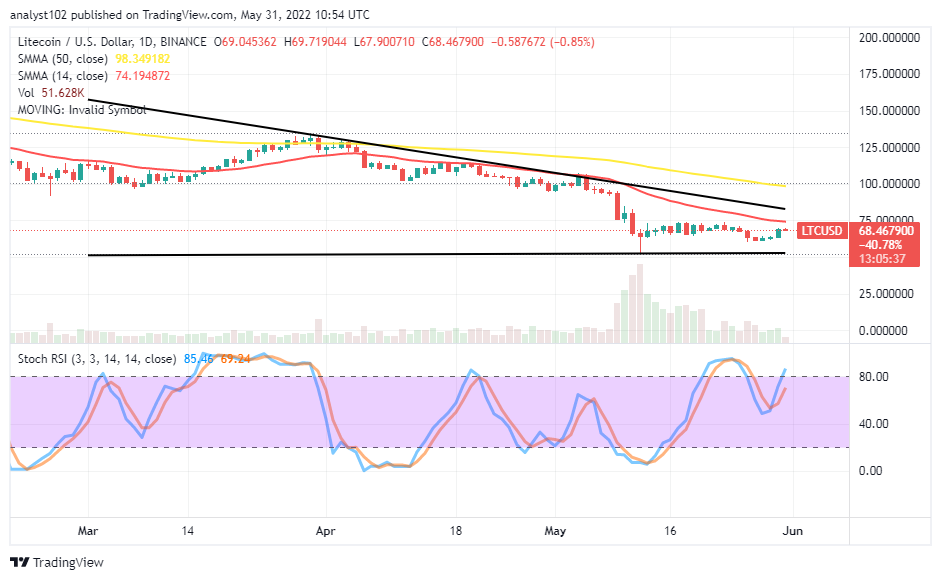
LTC/USD – Daily Chart
The LTC/USD daily chart exhibits the crypto-economic market fluctuates in a range settling close to the resistant-trading level of $75. The 14-day SMA trend line has moved southward to place a markdown, affirming the intensity of a resistance point at the value line beneath the 50-day SMA trend line. The Stochastic Oscillators are attempting the overbought region to probably signify the market may still enjoy some degrees of pushes to the upside for a while.
Will the LTC/USD market continue to fluctuate closely below the $75 resistance level?
As observed, the LTC/USD market fluctuates in a range settling may likely continue closely below the $75 resistance level for some time more. Buyers’ reactions have been forthcoming with a low-active motion, hence the reason for the current persistent ranging trend. It would not be an easy task to observe decent buying entry while the trading situation tends not to give in to a downward-trending move.
On the downside of the technical analysis, the LTC/USD market operations appear, heading toward getting resistance at a higher resistance soon. A candlestick may emerge soon afterward purposely to touch a resistance around the 14-day SMA. And that portends an expectation of having a reversal of any upward pressure in no time.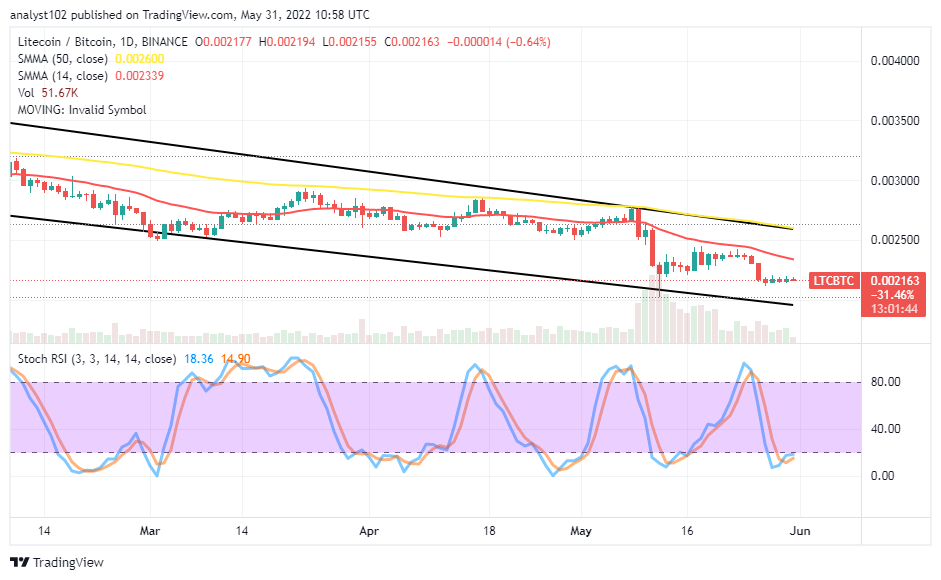
LTC/BTC Price Analysis
Litecoin (LTC/USD) MarkeIn comparison, Litecoin has continued debasing against the trending catalyst of Bitcoin, running into several sessions. The cryptocurrency pair market fluctuates in a range settling, showing smaller candlesticks representing a chain of lower lows in the last few days. The 50-day SMA indicator aligns with the upper bearish channel trend line drawn above the 14-day SMA indicator. The Stochastic Oscillators are down into the oversold region, signifying the downward forces haven’t been over yet. However, the strength-force backing the downward-trending motion seems to run into a recess to possibly cause an indecision-trading moment in the following days’ activities. The base crypto may resume striving for recovery against its counter crypto.
Note: Cryptosignals.org is not a financial advisor. Do your research before investing your funds in any financial asset or presented product or event. We are not responsible for your investing results.
“Lucky is up more than 50% today but still more than 430% from All Time Highs!
The opportunity to bank BIG is now!
You can purchase Lucky Block here. Buy LBlock