Litecoin (LTC/USD) Market Hits Resistance at $70
Estimated Reading Time: 3 minutes
Don’t invest unless you’re prepared to lose all the money you invest. This is a high-risk investment and you are unlikely to be protected if something goes wrong. Take 2 minutes to learn more
Litecoin Price Prediction – November 8
There has been exhaustion in the recent LTC/USD trade upward forces as the crypto market hits resistance around the $70 line. Due to a correction that is currently taking place in the cryptocurrency market, the price is currently trading at a negative percentage rate of 4.85, around the $64.08 value point.
LTC/USD Market
Key Levels:
Resistance levels: $70, $75, $80
Support levels: $60, $55, $50
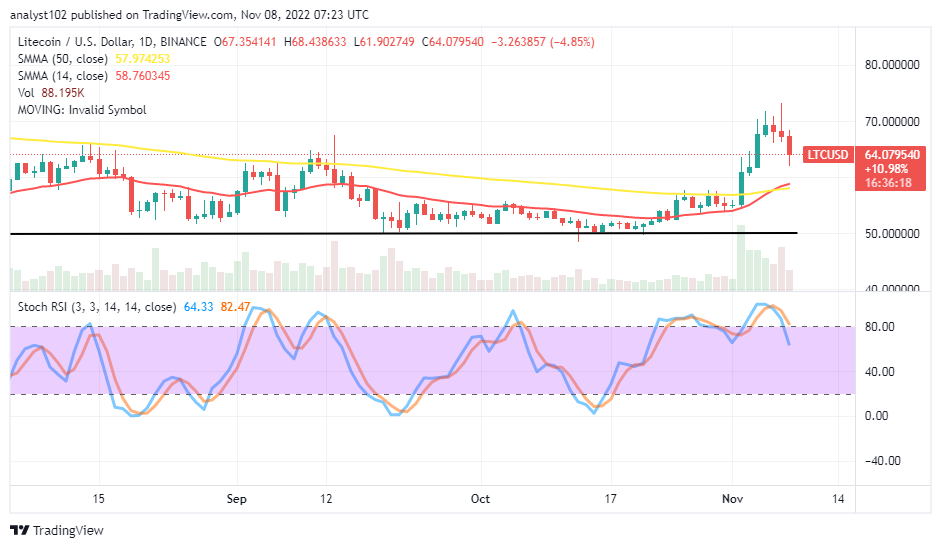
LTC/USD – Daily Chart
The daily chart showcases that the LTC/USD market hits resistance around the $70 trading level as the SMA trend lines are underneath. The 50-day SMA indicator is at $57.97, underneath the $58.76 point of the 14-day SMA indicator. A shift has occurred to put the pivotal support level at $60 against the previous baseline of $50. The Stochastic Oscillators have crossed southbound in the overbought region to 82.47 and 64.33 levels.
Has a dropping mode been established in the LTC/USD market activities around the $70 mark?
A declining pattern has been upheld in the LTC/USD trade operations as the crypto market hits resistance around the $70 trading level. Based on that sentiment, long-position placers stay off executing a buying order. The retracement motion is systemically back to touch a lower point to rebuild support around the trend lines of the SMAs. It may also take some time before getting a laudable stance to give back an upswing afterward.
On the downside of the technical analysis, the emergence of variant trading candlesticks, forming top shadows around the $70 resistance level, has signaled a confirmation of seeing more lows in the subsequent trading sessions below that value line. Technically, sellers wait for fake up-pulls coupling with quick reversals before executing an order in pursuance of their intention.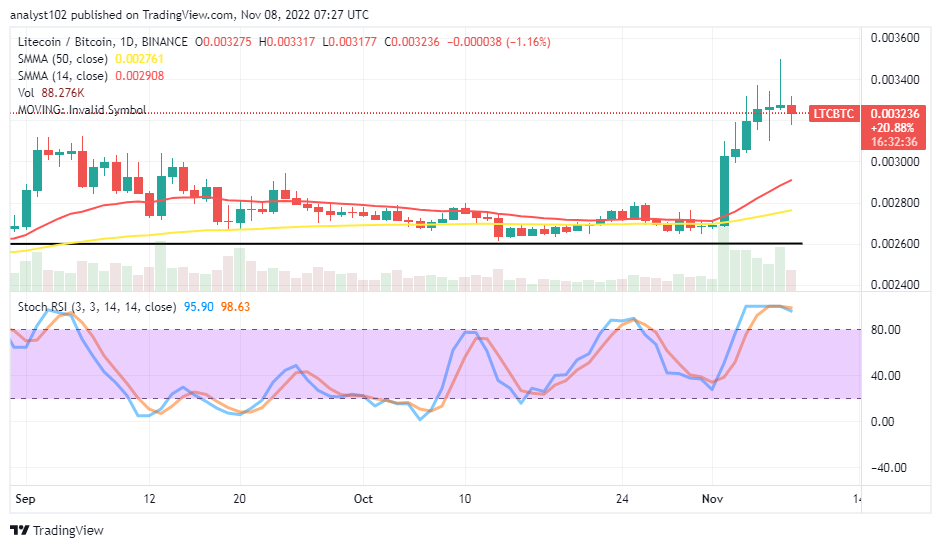
LTC/BTC Price Analysis
In comparison, Litecoin currently appears to have completed an upward-trending mission versus Bitcoin to a greater extent. The 14-day SMA indicator has swerved the trend line northward and curved over the trend line of the 50-day SMA. The Stochastic Oscillators have tightly conjoined their lines in the overbought region, trying to cross it southbound at 98.63 and 95.90 levels. That sounds like a warning signal against intending to get reliable ups in the following activities.
Note: Cryptosignals.org is not a financial advisor. Do your research before investing your funds in any financial asset or presented product or event. We are not responsible for your investing results.
You can purchase Lucky Block here. Buy LBLOCK