Polygon (MATIC/USD) Market Tries to Rally
Estimated Reading Time: 3 minutes
Don’t invest unless you’re prepared to lose all the money you invest. This is a high-risk investment and you are unlikely to be protected if something goes wrong. Take 2 minutes to learn more
Polygon Price Prediction – October 16
It appears the MATIC/USD trade operations have reached a maximum lower-trading spot the support line at $0.70 closely in about some days as the market tries to rally up through a logical near resistance line. Price is trading around $0.795 at a minute average percentage rate of 0.76 positives.
MATIC/USD Market
Key Levels
Resistance levels: $0.90, $0.95, $1
Support levels: $0.70, $0.65, $0.60
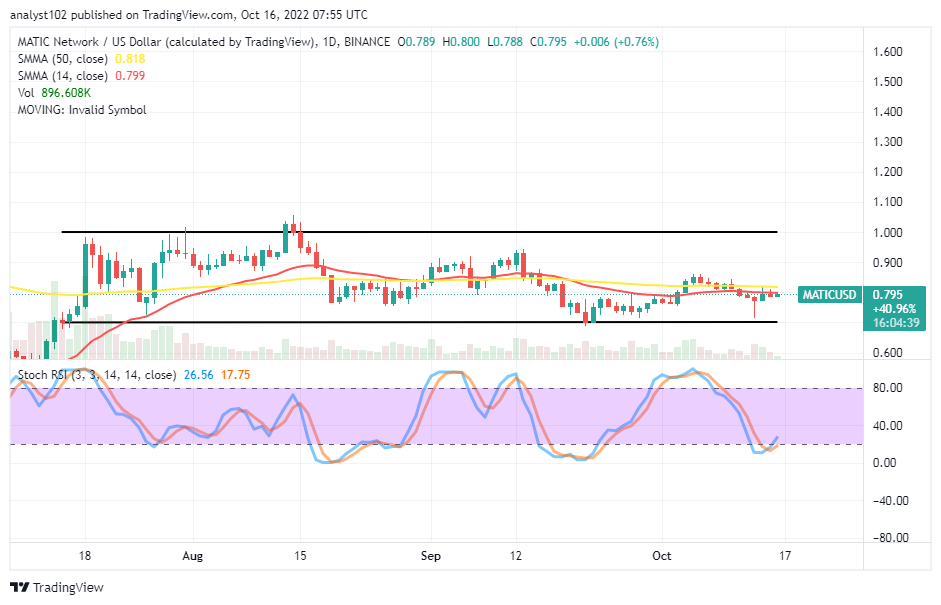
MATIC/USD – Daily Chart
The daily chart showcases the MATIC/USD market activity and tries to rally around the trend lines of the SMAs. The 14-day SMA indicator is at $0.799, underneath the $0.818 value line of the 50-day SMA indicator. The upper and the lower horizontal lines remain drawn at strategically located points, marking key resistance and support levels to either ups or downs afterward. The Stochastic Oscillators have initially dipped into the oversold region. And they are now trying to cross back northbound at 17.75 and 26.56 range values.
Which direction could the MATIC/USD market move in shortly?
The MATIC/USD market tries to rally against the SMA trend lines. On the 13th trading session, a trading candlestick occurred, spanning close to touching support around the $0.70 level. And it ended up with a bottom shadow shape to signify the possibility of getting some springs in the following operations. The baseline has been obtained at the value line to let buyers know the lower point that needs not to breach southward for sustainability in the long run.
On the downside of the technical analysis, the MATIC/USD market bears will have to consolidate their presence in the crypto economy around the values of the SMAs to gain a line of lower lows. It would be dicey for a seller to obtain stable downs even though a decline occurs eventually. In the meantime, short-position placers should be wary of launching new selling orders without considering the need to let the Stochastic Oscillators indicate the reaching of high-range values capable of suggesting exhaustion of an upward-trending move afterward.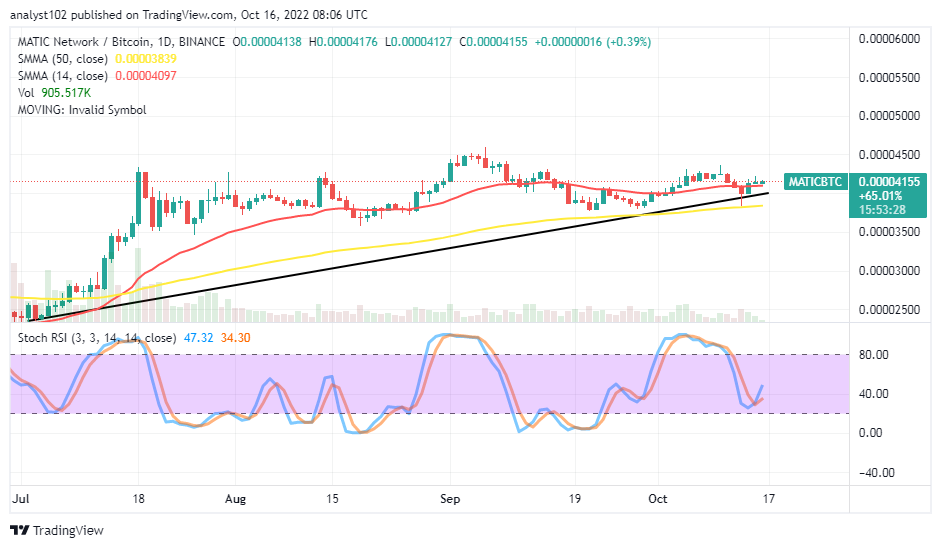
MATIC/BTC Price Analysis
In comparison, Polygon continues to hold points against Bitcoin around the relatively northward-trending outlook of the smaller SMA. In a more elaborate term, the pairing crypto market tries to rally from a near point over the bigger SMA briefly past the smaller SMA. The 14-day SMA trading indicator is closely above the 50-day SMA indicator. The Stochastic Oscillators have averaged closely over the range of 40. And they have crossed northbound at 34.30 and 47.32 range values. That shows the base crypto may build up momentum against its counter-trading crypto.
Note: Cryptosignals.org is not a financial advisor. Do your research before investing your funds in any financial asset or presented product or event. We are not responsible for your investing results.
You can purchase Lucky Block here. Buy LBLOCK