Litecoin (LTC/USD) Market Maintains Stances in $70 and $50
Estimated Reading Time: 3 minutes
Don’t invest unless you’re prepared to lose all the money you invest. This is a high-risk investment and you are unlikely to be protected if something goes wrong. Take 2 minutes to learn more

Free Crypto Signals Channel
Litecoin Price Prediction – August 23
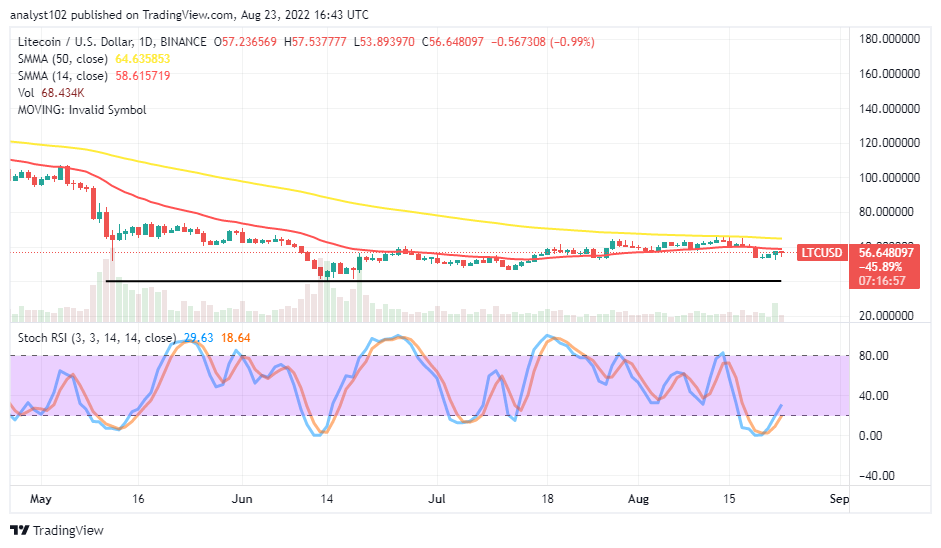
Over a couple of sessions, it portrays that the LTC/USD market activity maintains stances in the $70 and the $50 value lines. The low and high trading lines have witnessed $53.89 and $57.53 at an average minute negative percentage rate of 0.99 as of the time of writing.
LTC/USD Market
Key Levels:
Resistance levels: $70, $80, $90
Support levels: $50, $40, $30
LTC/USD – Daily Chart
The daily chart reveals the LTC/USD market maintains stances in the $70 and the $50 levels. The 14-day SMA trading indicator is at $58.61 beneath the $64.64 position of the 50-day SMA indicator. The critical baseline remains drawn at the 440 support level. The Stochastic Oscillators have attempted to cross northbound from the oversold region to the 18.64 and 29.63 range points.Will the LTC/USD trade remain depressing under the SMA’s sell signal settings?
The 14-day SMA indicator will be instrumental in the subsequent direction that price will go as the LTC/USD market maintains stances between the $70 and the $50 levels. Buying activities may still have to suffer decent entry order, especially while most of the time daily chart is used for deciding when to gain an entry order. Nevertheless, downward forces tend to get exhausted toward the $50 or the $40 levels to pave the way for a rebound. Therefore, buyers need to exercise caution toward letting that assumption play out before considering a buying order afterward.
On the downside of the technical analysis, sellers need to intensify efforts by exerting more pressure on the market, using the sell signal side of the 14-day SMA as a yardstick to spot active motion to continue the correction movement to a farther southward distance. A slow-and-steady northward push against the smaller SMA’s value at $58.61 will summarily nullify the potency of the market depressively further through lower support levels.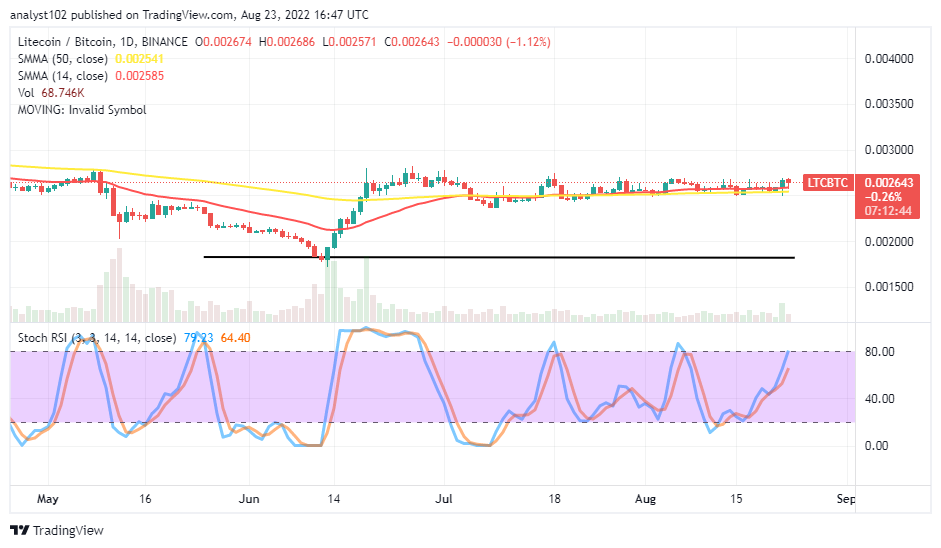 LTC/BTC Price Analysis
There has been a continual long-ranging movement showcasing Litecoin is holding positions at the higher-resistance trading point against Bitcoin. The cryptocurrency pair maintains stances around the trend lines of the SMAs. The 14-day SMA indicator has almost got conjoined with the 50-day SMA indicator. The Stochastic Oscillators have crossed northbound to the 64.40 and 79.93 range points. A sell signal has been raised by the formation of a bearish candlestick, denoting the base crypto risks the possibility of declining against the flagship crypto.
Note: Cryptosignals.org is not a financial advisor. Do your research before investing your funds in any financial asset or presented product or event. We are not responsible for your investing results.
You can purchase Lucky Block here. Buy LBLOCK