Litecoin (LTC/USD) Market Positions at the Bearish Trend-line
Estimated Reading Time: 3 minutes
Don’t invest unless you’re prepared to lose all the money you invest. This is a high-risk investment and you are unlikely to be protected if something goes wrong. Take 2 minutes to learn more

Free Crypto Signals Channel
Litecoin Price Prediction – April 19
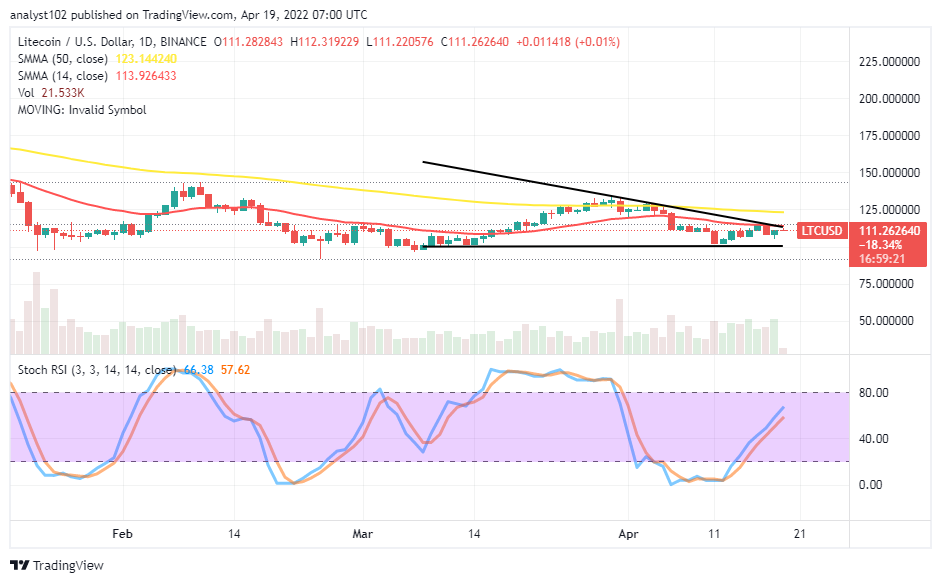
The LTC/USD market positions around the bearish trend-line drawn to signify a resistant trading condition have occurred. The crypto-economic price features a less-active motion between $112 and $111, maintaining a minute negative percentage of 0.01.
LTC/USD Market
Key Levels:
Resistance levels: $125, $135, $145
Support levels: $100, $90, $80
LTC/USD – Daily Chart
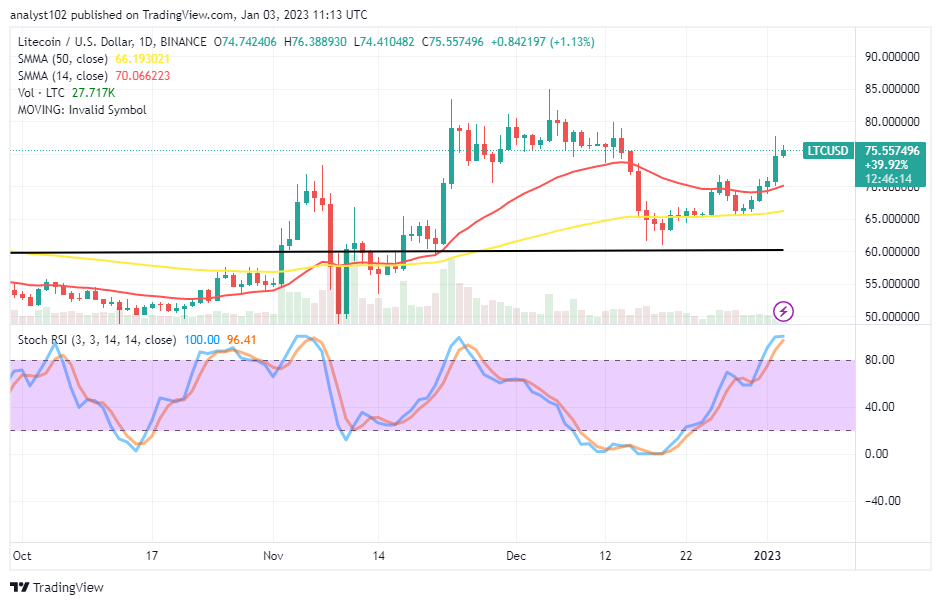
The LTC/USD daily chart shows the crypto-economic market positions at the bearish trend-line drawn alongside the smaller SMA. The 50-day SMA indicator is above the 14-day SMA indicator. The horizontal support baseline drew at $100. The Stochastic Oscillators are slantingly positioned northbound closely underneath the range at 80. The crypto economy may remain to hold its position in a recovery motion with less weight to the upside towards averaging the $125 resistance level.
Will the LTC/USD price move out of its trading zones of $125 and $100 soon as the market positions at the bearish trend line?
It is not technically visible that the LTC/USD price will push out of its current trading spots of $125 and $100 in the near time as the market positions at the bearish trend line. The slantingly positioning of the Stochastic Oscillations against some range lines to the northbound suggests a buying force leftover is hanging at a particular higher-trading spot. Therefore, if bulls hold their stances strong, the price may rally toward obtaining some of the previous highs afterward.
On the downside of the technical analysis, the LTC/USD market bears should be wary of fake rejections building up around the trend line of the smaller SMA. The present condition in the crypto economy seems not that safe to begin launching shorting orders. It would be ideal that the market is allowed to shoot up purposely to locate resistance around the $125 level or a bit higher to spot a reversal that can trail the move before contemplating a sell order.
LTC/BTC Price Analysis
In comparison, it now appears that Litecoin is on the verge of losing momentum to Bitcoin at a high considerable resistant trading spot. The cryptocurrency pair market positions closely underneath the conjoint area of the upper bearish trend line and the 50-day SMA above the trend line of the 14-day SMA. A small bearish candlestick is in the making, trying to feature against the smaller-trading indicator. The Stochastic Oscillators have crossed southbound from the overbought region against the range of 80, signaling a possible return of downsizing motion in the pairing cryptos’ business operations. Therefore, the base instrument may soon be going down in response to forces inflicted in the market by the flagship counter crypto.
Note: Cryptosignals.org is not a financial advisor. Do your research before investing your funds in any financial asset or presented product or event. We are not responsible for your investing results.
You can purchase Lucky Block here. Buy LBlock: