XRP Oscillates as Rising Movement Halts at $0.64
Estimated Reading Time: 2 minutes
Don’t invest unless you’re prepared to lose all the money you invest. This is a high-risk investment and you are unlikely to be protected if something goes wrong. Take 2 minutes to learn more

XRP (XRP) Long-Term Analysis: Bearish
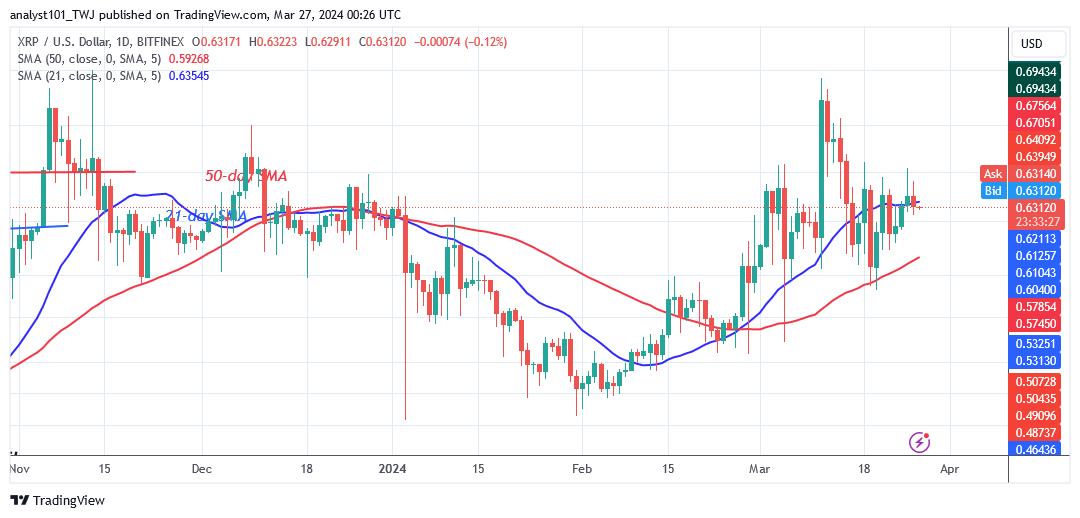
The XRP (XRP) price has been trading between the 21-day SMA resistance and the 50-day SMA support as rising movement halts at $0.64. Since March 16, 2024, the decline has been called above the 50-day SMA. The resistance at $0.66, or the 21-day SMA, is holding back the rising movements. XRP is now worth $0.632 at the time of writing.
On the upside, if XRP rebounds and breaks above the 21-day SMA, the market will return to its prior high of $0.74. The altcoin will remain range-bound between the moving average lines where the bulls fail to break the previous high.
Technical Indicators:
Major Resistance Levels – $1.00, $1.50, $2.00
Major Support Levels – $0.50, $0.30, $0.10
XRP (XRP) Indicator Analysis
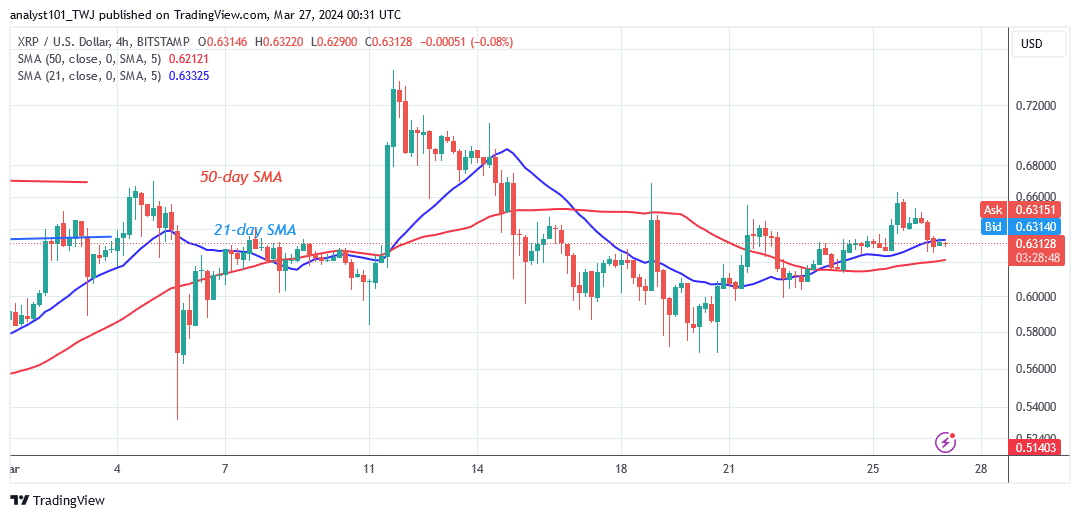
XRP’s price bars are situated between the moving average lines. This means that the coin will experience further price fluctuations. The moving average lines are trending up, showing the current trend. Doji candlesticks dominate the XRP price bars, regulating price movement.
What Is the Next Direction for XRP (XRP)?
The cryptocurrency remains locked in a range as rising movement halts at $0.64. The present price oscillations may persist as the altcoin encounters another rejection at the resistance zone. The presence of Doji candlesticks has caused the price movement to remain steady. The crypto signal will remain range-bound due to the current confinement.
You can purchase crypto coins here. Buy LBLOCK
Note: Cryptosignals.org is not a financial advisor. Do your research before investing your funds in any financial asset or presented product or event. We are not responsible for your investing results