Litecoin (Ltc/Usd) Now Hits a Strong Resistance at $300 Line
Estimated Reading Time: 3 minutes
Don’t invest unless you’re prepared to lose all the money you invest. This is a high-risk investment and you are unlikely to be protected if something goes wrong. Take 2 minutes to learn more
Litecoin Price Prediction – May 4
LTC/USD, in its current quest of making a recovery moving mood, has encountered a resistant point around the level of $300 during yesterday’s trading session. As of now, price reverses downward a bit more along yesterday’s bullish wall.
LTC/USD Market
Key Levels:
Resistance levels: $320, $340, $360
Support levels: $250, $230, $210
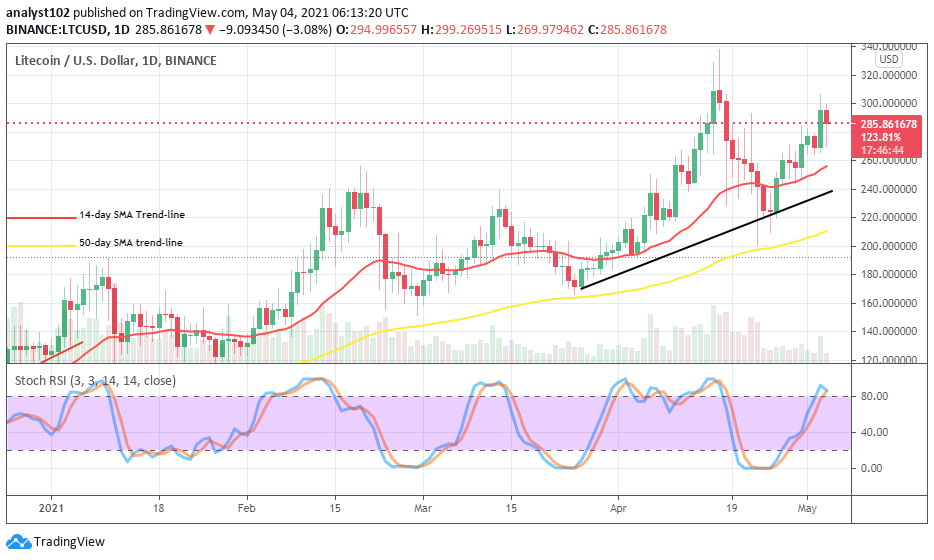
LTC/USD – Daily Chart
At the early trading hour of today, the LTC/USD daily chart has depicted that the current slight bearish candlestick takes its forming at the test of the $300 resistance point. That signifies that the crypto’s value is losing momentum on a gradual note in the market. The 14-day SMA trend-line trails the $260 level very closely from below as the bullish trend-line drew northward below it to place at the $240 support level. And, the 50-day SMA indicators are in the overbought region trying to close the hairs at the range of 80. That gives a warning signal against the possibility of seeing the smooth running of an upward trend as of writing.
Will there soon be heightened sell-pressures around the LTC/USD $300 price?
Going by the current northward pushing power of the LTC/USD bulls, an indication has occurred to dowse smooth running of the crypto’s worth to the north as paired with the US Dollar. as a result, the crypto-market may now have to face other rounds of correctional move in a bid to find support around $260 or possibly $240 in an extension should the current slight sell-pressure eventually go intense.
Analyzing against the further upward movement of this market, bears will to timely make use of the current situation by exerting more pressures around the key $300. A loss of putting more selling pressures around the point earlier mentioned may lead them to wait for higher levels of resistance trading zone at a later session.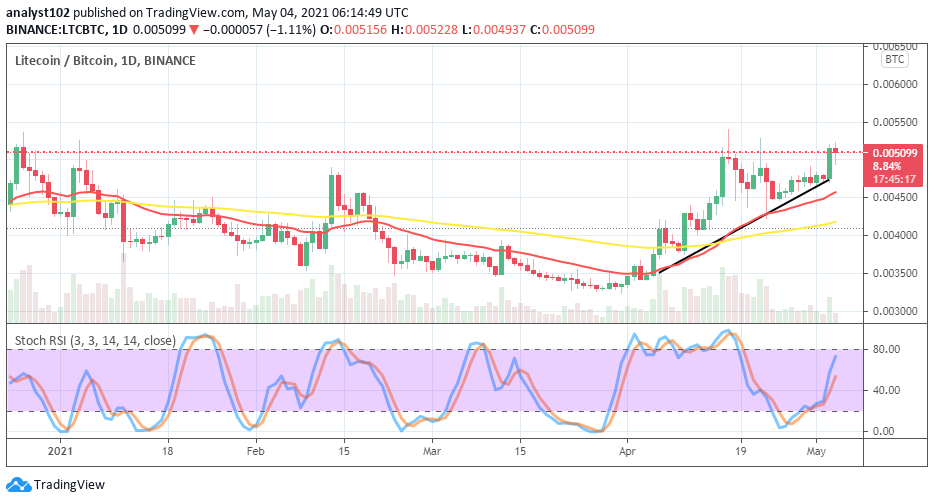
LTC/BTC Price Analysis
Taking a look at the weighing the market valuation between LTC and BTC, it is still recorded that the base trading tool outpaces its countering instrument in the comparison. The 50-day SMA indicator is underneath the 14-day SMA trend-line. And, they still point to the north. The Stochastic Oscillators are now pointing towards the north below range 80 to signify the probability of getting to see more ups denoting the LTC market appreciation as compared with the flagship cryptocurrency in the next session.
Note: cryptosignals.org is not a financial advisor. Do your research before investing your funds in any financial asset or presented product or event. We are not responsible for your investing results.


