Litecoin (LTC/USD) Price Averages $60 Resistance
Estimated Reading Time: 3 minutes
Don’t invest unless you’re prepared to lose all the money you invest. This is a high-risk investment and you are unlikely to be protected if something goes wrong. Take 2 minutes to learn more

Free Crypto Signals Channel
Litecoin Price Prediction – June 21
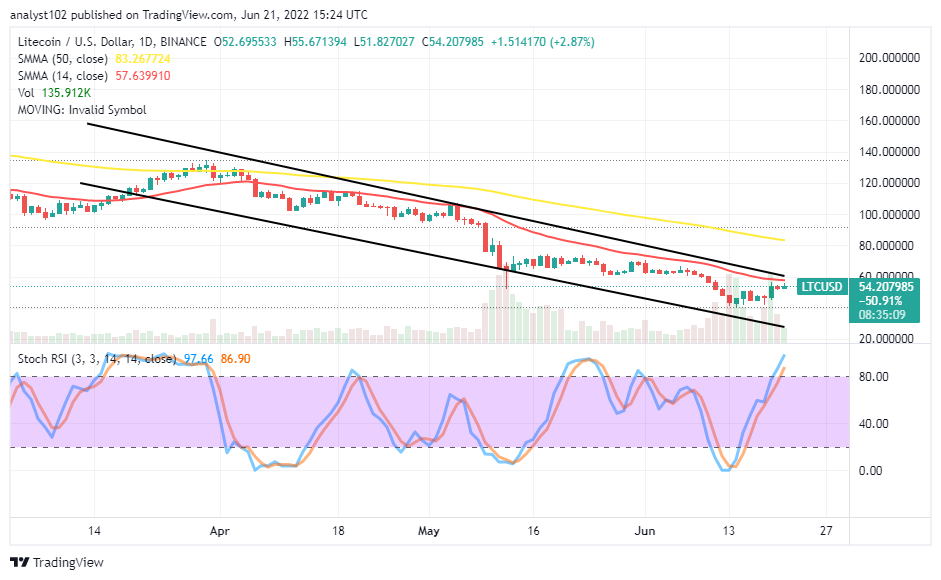
The current obtainable market situation of the LTC/USD shows the crypto-economic price averages $60 resistance line. Price is trading around the $54 line at a positive percent rate of 2.87.
LTC/USD Market
Key Levels:
Resistance levels: $60, $70, $80
Support levels: $40, $30, $20
LTC/USD – Daily Chart
The LTC/USD daily chart reveals the crypto market price averages the $60 resistance level around the trend line of the smaller SMA. The 14-day SMA indicator is underneath the 50-day SMA indicator. The bearish trend line drew southward to affirm the value line possesses a tough-barrier point against the subsequent upward swings. The Stochastic Oscillators have sprung northbound into the overbought region. And they still point toward the north side.
Will the LTC/USD market lose momentum soon around the $60 resistance level?
The LTC/USD market stands the risk probability of losing the momentums soon around the $60 resistance level as there has been an overbought reading condition. Long-position takers are to exercise patience until the crypto economy runs downward to find support around or below the $30 level before considering launching a buying order. The crypto economy’s price may get a clue from reading the Stochastic Oscillators in the lower-range trading zone to suggest a ripe time to buy back into the pairing instruments.
On the downside of the technical analysis, as it observed that the LTC/USD market is trading in an overbought region, short-position takers needed to be alert to spot an active correctional motion around the resistance levels stated before considering the launching of a selling order.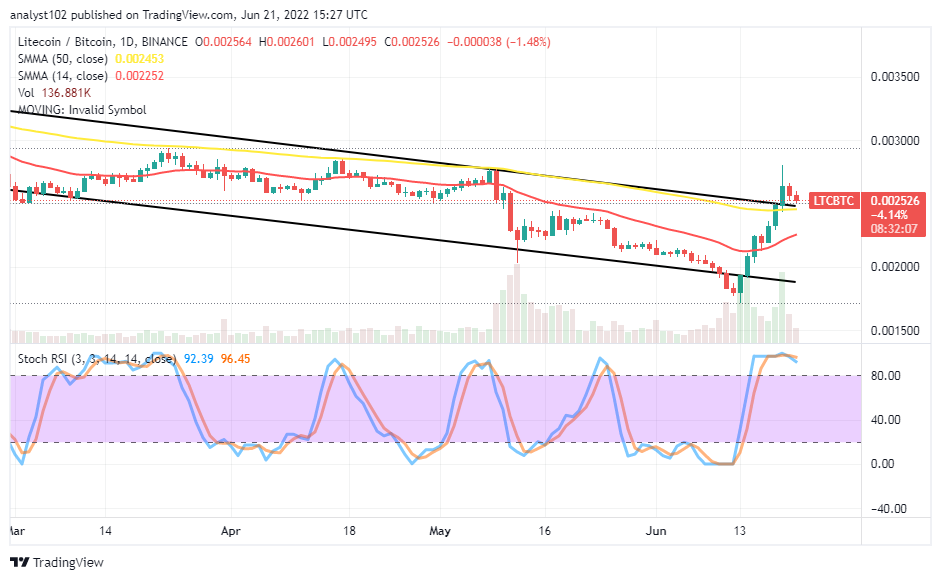
LTC/BTC Price Analysis
In comparison, Litecoin, in the last couple of days, has been pushing against the trending capacity of Bitcoin. The cryptocurrency pair price averages a higher resistance point not too far above the bigger SMA. From yesterday’s session until the present, the candlesticks featured showcase bearish signals to denote the counter crypto is gradually regaining stances against the base crypto. The upper bearish trend line drew alongside the 50-day SMA indicator above the 14-day SMA indicator. The Stochastic Oscillators are in the overbought region, trying to cross southbound. That shows a downward-trending force is in the offing.
Note: Cryptosignals.org is not a financial advisor. Do your research before investing your funds in any financial asset or presented product or event. We are not responsible for your investing results.
“Lucky is up more than 50% today but still more than 430% from All Time Highs!
The opportunity to bank BIG is now!
You can purchase Lucky Block here. Buy LBlock