Litecoin (LTC/USD) Price Shows Weakness at $57
Estimated Reading Time: 3 minutes
Don’t invest unless you’re prepared to lose all the money you invest. This is a high-risk investment and you are unlikely to be protected if something goes wrong. Take 2 minutes to learn more

Free Crypto Signals Channel
Litecoin Price Prediction – August 30
There has been a long less-active move in the LTC/USD market operation as the crypto’s price shows weakness around $57 that it should have breached northward. The market has been between the $56 and $54 value lines. Price is at an average percentage of 2.83.
LTC/USD Market
Key Levels:
Resistance levels: $70, $80, $90
Support levels: $50, $40, $30
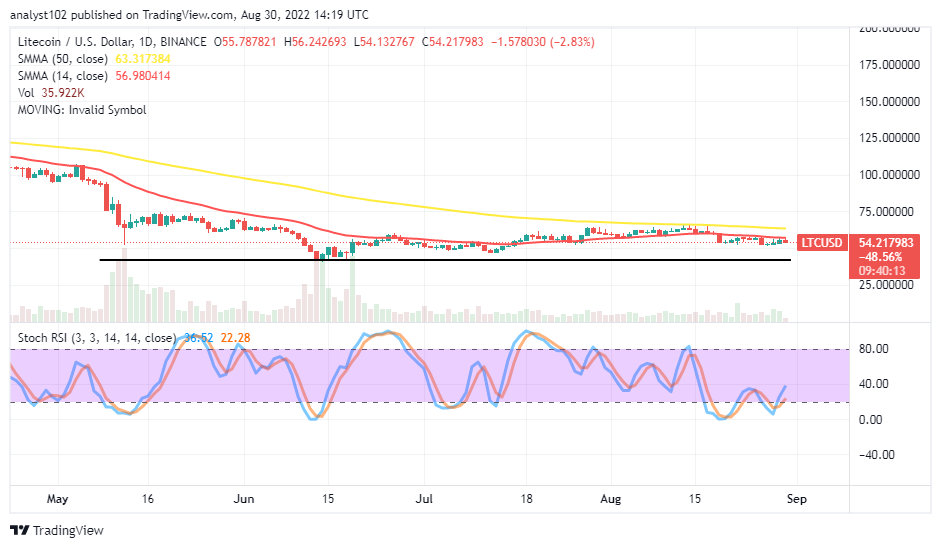
LTC/USD – Daily Chart
The LTC/USD daily chart depicts the crypto-economic price shows weakness around the $57 value line, which is approximate to the smaller SMA trend line. In precise, the 14-day SMA indicator is at $56.980414 underneath the $63.317384 value line of the 50-day SMA indicator. The horizontal line drawn at the $42 to closely have the exact lower point price has been able to swing up while the bearish cycle trading was intense. The Stochastic Oscillators are slightly up and down in all the range points below 40. And they have briefly swerved northbound to 22.28 and 36.52 range values.
Will the LTC/USD market lose more stances to the downside?
A bearish candlestick is in the making around the resistance value line of the 14-day SMA as the LTC/USD market price shows weakness around $57. That portends an uneasy trading situation for the LTC/USD market long-position placers to push their buying orders into profits. At this point, traders need to use a correlating outlook that can signal a favorable change of direction to the upside before considering a buying order.
On the downside of the technical analysis, there has been a low-active declining motion around the sell signal side of the 14-day SMA. The impending force appears technically unideal for trading on the daily chart. Sellers may still need to shun joining the trend based on its lower probability of gaining intense pressures to push lower more sustainably in the long-term running mode.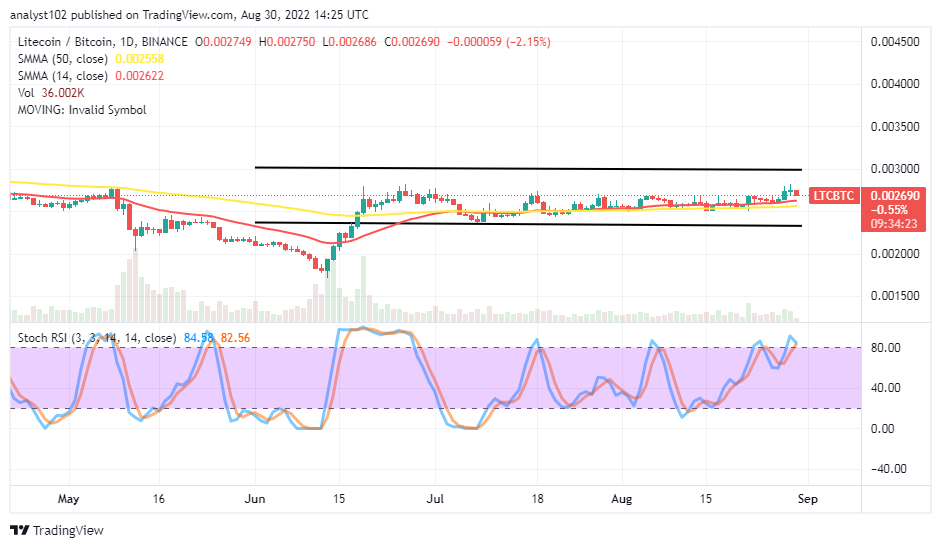
LTC/BTC Price Analysis
The trending force between Litecoin and Bitcoin has continued to feature a series of higher lows around the conjoined trend lines of the SMAs. The 14-day SMA indicator is slightly above the 50-day SMA indicator. And they are pointing eastward to affirm that a chain of ranging moves is in force. The stochastic Oscillators have penetrated the overbought region to maintain 82.56 and 84.58 range values. They are now seemingly attempting to cross southbound to signify the base crypto stands a risk of downsizing as it pairs with its counter crypto soon.
Note: Cryptosignals.org is not a financial advisor. Do your research before investing your funds in any financial asset or presented product or event. We are not responsible for your investing results.
You can purchase Lucky Block here. Buy LBLOCK