Tamadoge (TAMA/USD) Stalls at $0.001 Amidst Ongoing Price Tug-of-War
Estimated Reading Time: 3 minutes
Don’t invest unless you’re prepared to lose all the money you invest. This is a high-risk investment and you are unlikely to be protected if something goes wrong. Take 2 minutes to learn more
The Tamadoge market has been characterized by a period of consolidation, with the price remaining relatively stable near the $0.001 level. Initially perceived as a resistance level, the price has now settled above this point, suggesting that bullish forces have successfully established it as a support level. Buyers appear to be actively defending this price point, indicating a potential shift in market sentiment.
As previously noted, bearish sentiment began to gain traction around the $0.0015 mark, characterized by a series of descending peaks. However, bullish forces countered this downward pressure, finding support at $0.00078 and initiating a rebound. The convergence of these opposing forces at the $0.001 level on September 10 has resulted in a prolonged period of sideways trading.
Key Levels
- Resistance: $0.013, $0.014, and $0.015
- Support: $0.0008, $0.00078 and $0.00074
TAMA/USD Price Analysis: The Indicators’ Point of View
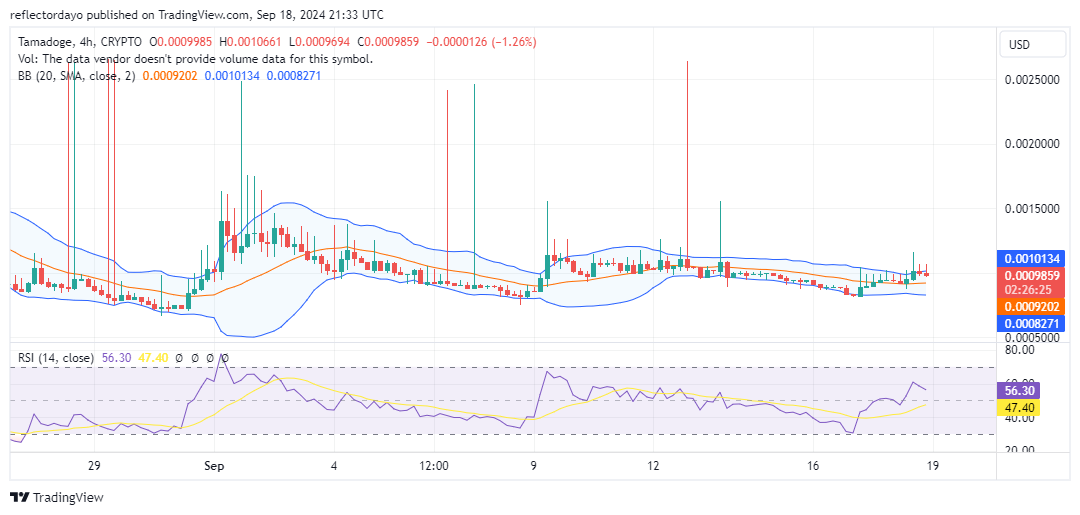
The appearance of long upper shadows on the past three consecutive candlesticks on the 4-hour chart suggests that the price of TAMA/USD may be facing downward pressure. A breakdown from the current level of $0.001 is a possibility, and the 20-day moving average at $0.00091 could serve as a potential support level or a point of rebound.
Although bullish forces have demonstrated significant resilience in defending the $0.001 level, the recent price action indicates that a decline may be imminent. If the price does indeed break down, the $0.00091 level could offer a strategic point for buyers to re-enter the market and potentially initiate a recovery.
Tamadoge Short-Term Outlook: 1-Hour Chart
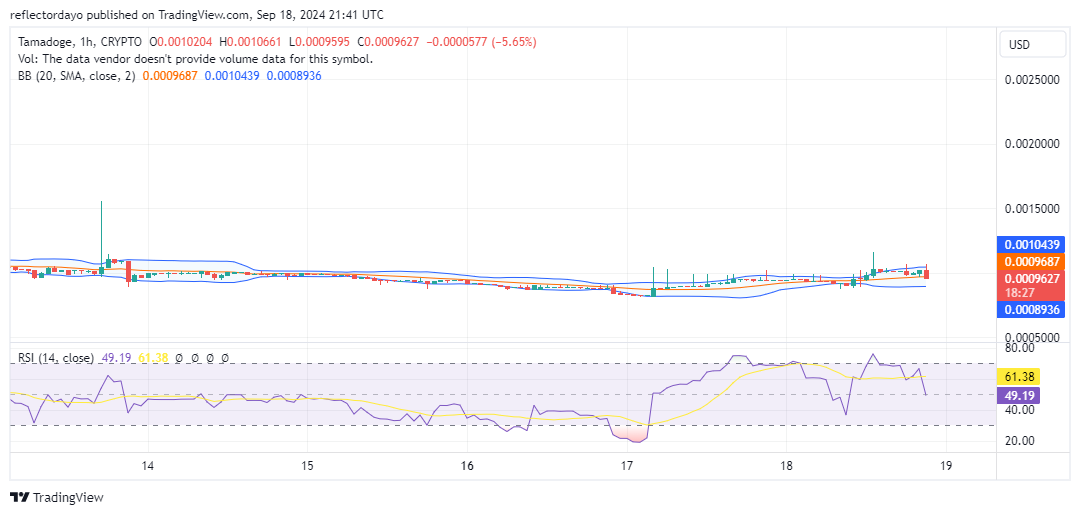
The Bollinger Bands on the 1-hour chart have widened in response to recent price fluctuations, indicating a surge in market volatility. This heightened volatility has provided an opportunity for bearish forces to drive the price downward.
While the current bearish momentum appears strong, the overall direction of the price channel remains uncertain. This crypto signal suggests that bullish forces have not been entirely eliminated from the market. There is a possibility that buyers may capitalize on the current market momentum and initiate a rebound. The next significant resistance level is likely to be at $0.0011. If the price breaks above this level, it could signal a resurgence of bullish sentiment.
Buy TAMA/USD!
Fill your weekend by playing five exhilarating play-to-earn arcade games! 🕹️💰
Battle your way to the top of the weekly leaderboards and load up on $TAMA rewards!
Download on mobile now 👇
📱 Android: https://t.co/D4TjX7gTFl
📱 iOS: https://t.co/0fjJapf5oA pic.twitter.com/6MCruiKcet— TAMADOGE (@Tamadogecoin) September 13, 2024