Polkadot Is Trading Below the Resistance Level of $6.81
Estimated Reading Time: 2 minutes
Don’t invest unless you’re prepared to lose all the money you invest. This is a high-risk investment and you are unlikely to be protected if something goes wrong. Take 2 minutes to learn more
Polkadot (DOT) Long-Term Analysis: Bullish
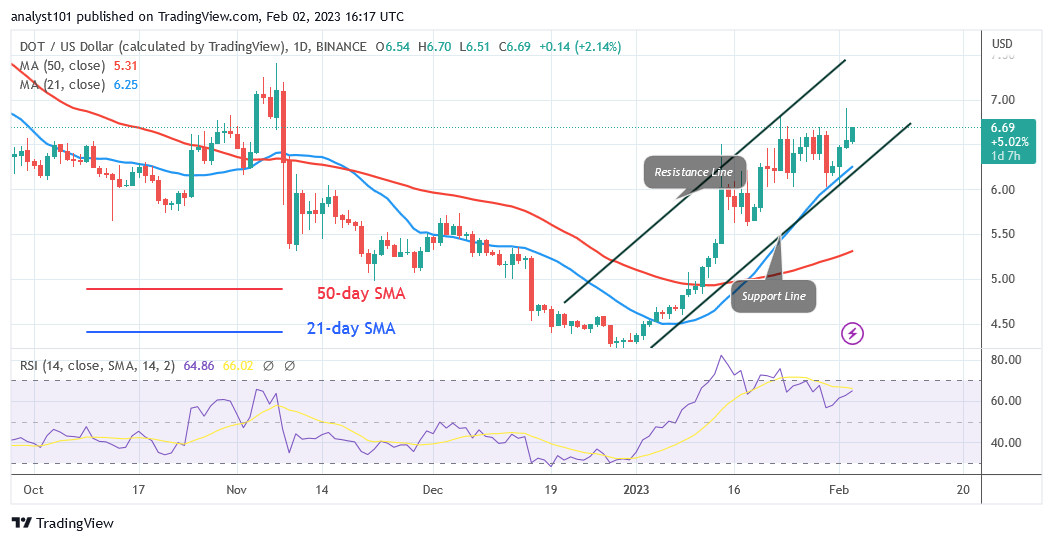
Polkadot’s (DOT) price has only risen to a high of $6.56 below the resistance level of $6.81. Above the $6.56 high, buyers were unable to maintain the positive momentum. Polkadot has been bouncing below the resistance level for the past week. The cryptocurrency asset is currently advancing to retest the $7.00 resistance. Since January 23, buyers have not breached the barrier line. If the current resistance level is broken, the cryptocurrency asset will rise to the next resistance level at $7.41. Nevertheless, since January 23, the upward trend has come to a standstill at the $6.81 high. The price has been ranging between $6.00 and $6.81. If purchasers are unable to surpass the most recent high, the altcoin will drop to the lower price range of $6.00. The DOT price will retrace to the $6.00 support on the downside. If the $6.00 support level is violated, the downward trend will resume.
Polkadot (DOT) Indicator Analysis
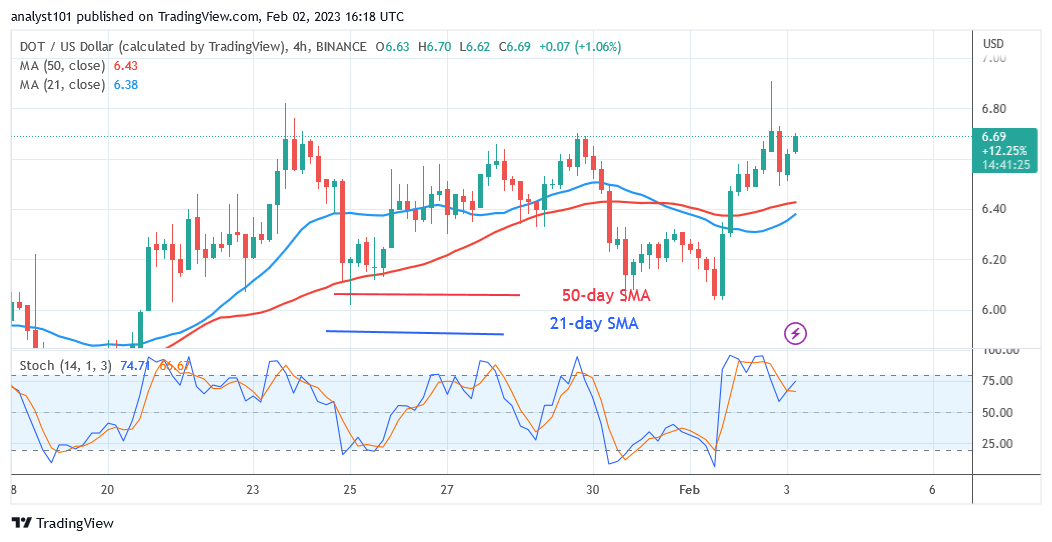
Polkadot is gaining momentum at Relative Strength Index level 65 for period 14. As long as the price bars are above the moving average lines, there is potential for further price movement. Above level 60 of the daily Stochastic, the DOT price is in a positive trend. The 50-day line SMA, like the 21-day line SMA, is sloping northward, indicating an uptrend.
Technical indicators:
Major Resistance Levels – $10, $12, $14
Major Support Levels – $8, $6, $4
What Is the Next Direction for Polkadot (DOT)?
Despite trading in a constrained range between values of $6.00 and $6.81, Polkadot is below the resistance level of $6.81. The $6.81 resistance has stymied the upward movement. When the current levels are broken, the altcoin will trend.
You can purchase crypto coins here. Buy LBLOCK
Note: Cryptosignals.org is not a 1a financial advisor. Do your research before investing your funds in any financial asset or presented product or event. We are not responsible for your investing results