Litecoin (LTC/USD) Price Struggles, Rallying at $150
Estimated Reading Time: 3 minutes
Don’t invest unless you’re prepared to lose all the money you invest. This is a high-risk investment and you are unlikely to be protected if something goes wrong. Take 2 minutes to learn more
Litecoin Price Prediction – December 14
The present LTC/USD business activity witnesses the crypto-economic price struggles, rallying at $150 at a positive percentage rate of about 4.00. The market worth is trading, exactly, around the same value line mentioned earlier as of writing.
LTC/USD Market
Key Levels:
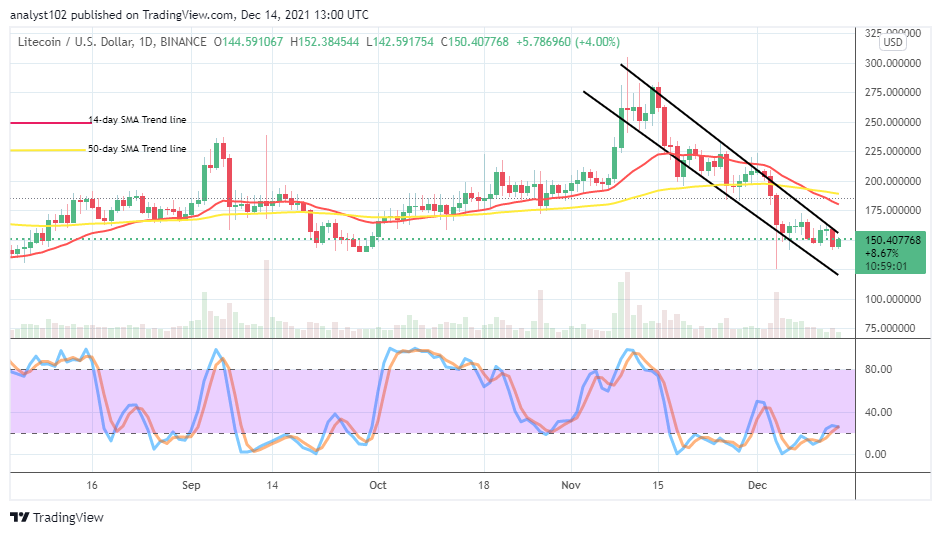
Resistance levels: $175, $200, $225
Support levels: $125, $100, $75
LTC/USD – Daily Chart
The LTC/USD daily chart showcases the crypto-economic price struggles, rallying at $150. A candlestick has been in the making, trying pulling northward closely to the upper bearish trend line underneath the SMA indicators. The lower bearish trend line drew to mark $125 as the critical support baseline. The 50-day SMA trend line is above the 14-day SMA trend line. The Stochastic Oscillators are seemingly northbound, consolidating from the oversold region, reaching the range of 20. That indicates that the crypto market may feature less-active forces, pushing to the north side for a while.
Should traders expect a forceful breakout against the upper bearish trend line as the crypto-economic price struggles, rallying at $150?
Presently, there has been a move representing a northward-beefing candlestick as the LTC/USD economic price struggles, rallying at $150 to put long-position takers on a better hedge scale to start making buying orders. The use of lower time frames will allow traders to determine the time to exert buying orders, especially when the price is underneath the indicators. Active price action is also needed to aid the long-positioning order into getting timely profits.
On the downside of technical analysis of the crypto market, some resistance trading barriers await any effort of the market trying to breach past $175 in the early time. In other words, it is expected, the LTC/USD trade short-position takers to take advantage of that situation with cautiousness when it has to come to play. The subsequent downward pressures seem below the value line still believe, won’t have the capacity to sustainably push beyond $125 even if there be more depression around the resistance point mentioned earlier afterward.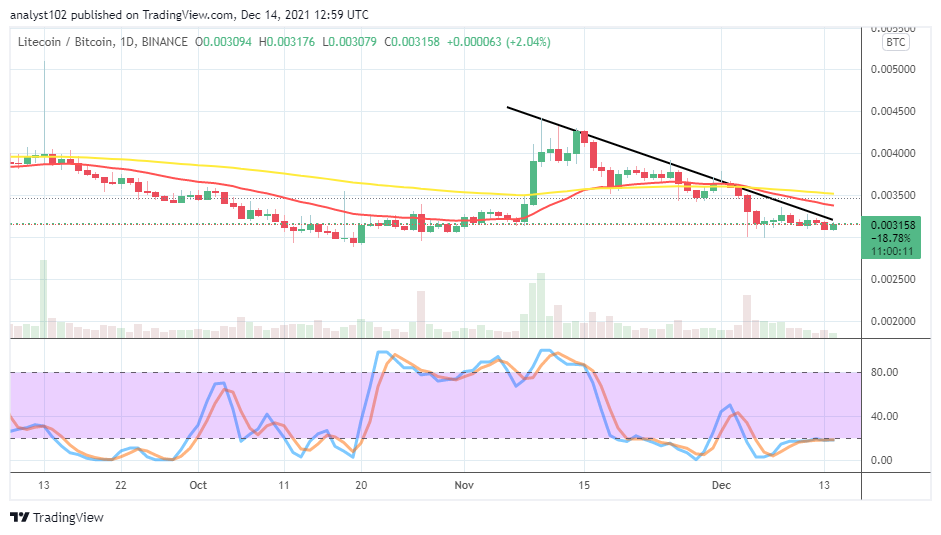
LTC/BTC Price Analysis
In comparison, Litecoin’s trending capacity as paired with Bitcoin runs under a falling force as indicated on the price analysis chart. The cryptocurrency pair price has continued to trade underneath the trend lines of the SMAs. The bearish trend line drew across the SMA trend lines to ascertain the path of the crypto pair keeps to the downside. The 14-day SMA indicator is underneath the 50-day SMA indicator. The Stochastic Oscillators are in the oversold region with their lines conjoined, seemingly slanting northbound around the range of 20. That indicates the base crypto finds it hard to push more visibly against the counter crypto.
Note: Cryptosignals.org is not a financial advisor. Do your research before investing your funds in any financial asset or presented product or event. We are not responsible for your investing results.
You can purchase crypto coins here. Buy Tokens