LTC/USD Price Update: Litecoin Tries to Retrace at $55 Level
Estimated Reading Time: 3 minutes
Don’t invest unless you’re prepared to lose all the money you invest. This is a high-risk investment and you are unlikely to be protected if something goes wrong. Take 2 minutes to learn more
Litecoin Price Prediction – October 25
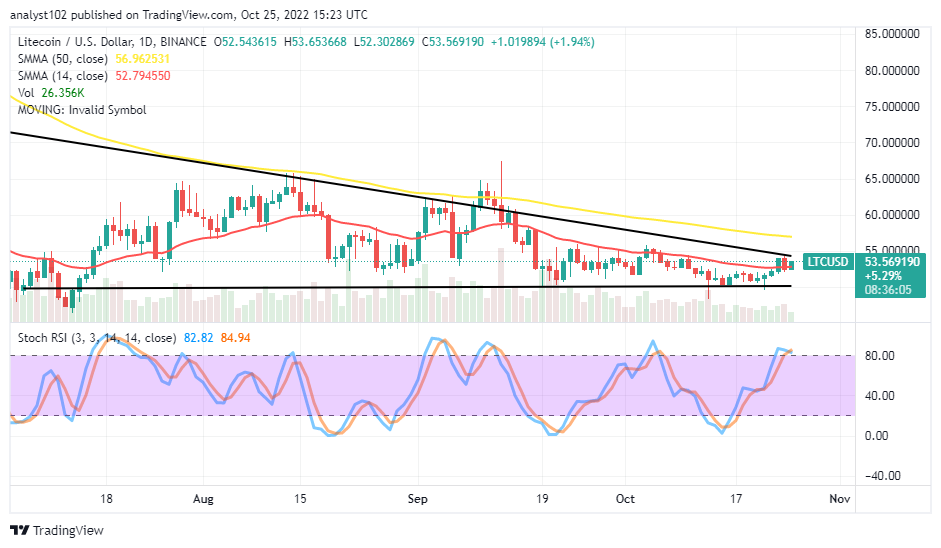
Buyers’ efforts to push northward further in the LTC/USD market operations have been on a gradual-moving mote as the crypto-economic price tries to retrace at the $55 level. As of the time of writing, the crypto’s worth against the US Dollar trades around $53.57 at an average rate of 1.94 percent positive.
LTC/USD Market
Key Levels:
Resistance levels: $55, $60, $65
Support levels: $50, $45, $40
LTC/USD – Daily Chart
The LTC/USD daily chart reveals that the crypto-economic price tries to retrace at the $55 trading level. It would be the third time since September 24th, October 5th, and possibly today’s may mark other rounds of a usual downward-trending motion that has kept concurrently occurring around the value line. The Stochastic Oscillators have briefly penetrated the overbought region. And they are now trying to close their lines at 84.94 and 82.82 range values.
At this point, how should the LTC/USD market traders approach their new presence?
In the first place, long-position placers that have taken profitable opening positions around a lower-trading spot of $50 support level should trail their entry as the crypto price tries to retrace around the $55 level. Secondly, Buyers should avoid jumping into any possible spike attempting to break out at the value line resistance point to not being whipsawed in no time.
On the downside of the technical analysis, there is the possibility that the LTC/USD trade long-position takers will lose the catalyst to sustain price in the points of the smaller and the bigger SMA trend lines afterward. Therefore, selling activities are to prevail in a slow-and-steady moving nature. In the wake of that assumption coming forth to materialize, the crypto economy will go down to as low as the previous lower-trading zone at $50.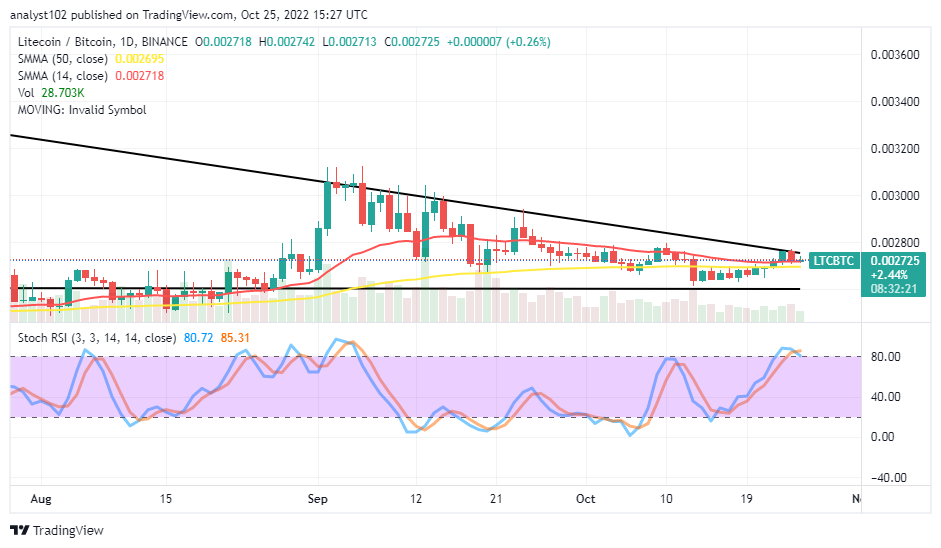
LTC/BTC Price Analysis
In comparison, Litecoin appears to be trading in a bearish triangular shape against Bitcoin at a high-trading spot, involving the presence of the SMA trend lines within. As it is, the pairing cryptocurrency market price tries to retrace around a resistance point near the SMAs. The 14-day SMA indicator is closely over the 50-day SMA indicator. The Stochastic Oscillators have briefly crossed southbound at 85.31 and 80.72 range points. That shows there will soon be a debasing move between the duo cryptos as they pair.
Note: Cryptosignals.org is not a financial advisor. Do your research before investing your funds in any financial asset or presented product or event. We are not responsible for your investing results.
You can purchase Lucky Block here. Buy LBLOCK