Litecoin (LTC/USD) Price Upsurges Strongly to Touch a Higher Value of $400
Estimated Reading Time: 3 minutes
Don’t invest unless you’re prepared to lose all the money you invest. This is a high-risk investment and you are unlikely to be protected if something goes wrong. Take 2 minutes to learn more
Litecoin Price Prediction – May 11
There has been a huge upsurge in the market worth of LTC/USD over a couple of trading days’ sessions. Currently, price has briefly reversed at a reduction of about 0.78% to trade at the level of $356 or thereabout.
LTC/USD Market
Key Levels:
Resistance levels: $420, $460, $500
Support levels: $300, $280, $260
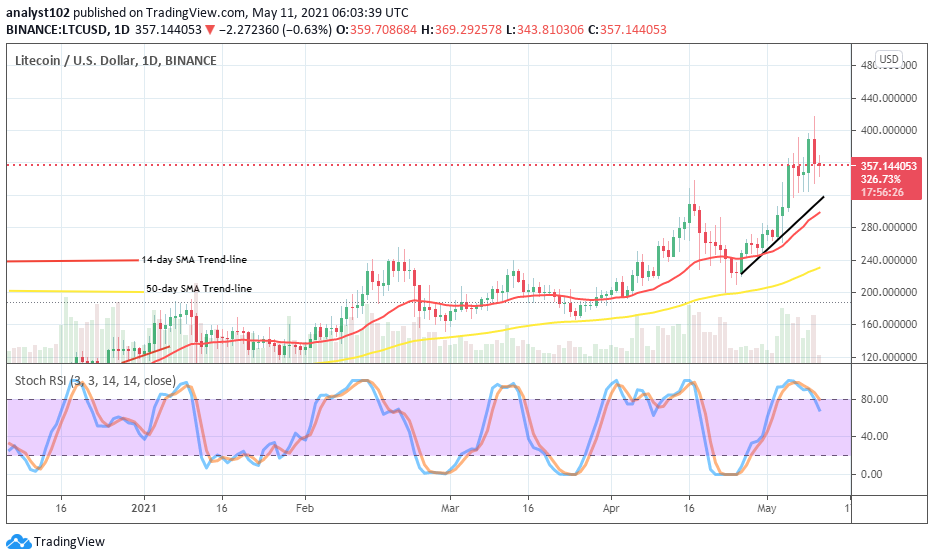
LTC/USD – Daily Chart
The LTC/USD daily chart depicts the rate at which the crypto pressurized its movement in the market to briefly touch past a higher resistance level of $400 on May 10 before getting a current small reverse. And, there has been a formation candlesticks convergence around $360 level. The 14-day SMA trend-line is above the 50-day SMA indicator. The Stochastic Oscillators have slightly crossed from the overbought region to position a bit below range 80 pointing to the south with a probable warning signal against the backdrop of seeing more smooth upward moves in the next cycle.
Will the LTC/USD market soon break past the $400 resistance point?
The technical SMA indicators yet suggest that some buying pressures will long be featuring on their buy signal side for a memorable trading time in the LTC/USD market. Therefore, bulls need to consolidate their stance in the crypto-trade around $320 to ensure that the $300 immediate support level isn’t breached southbound. However, a quick rebounding move at that lower support point will give a brighter return of an upward move continuation.
On the contrary, as regards the upside moves, bears need to await the market to face another round of rejection at the level of $400 before considering a sell-positioning order. Sudden intense selling pressure at the level of $360 may in no time put the market on a round of price corrections may lead to a revisit of a lower support line around $280.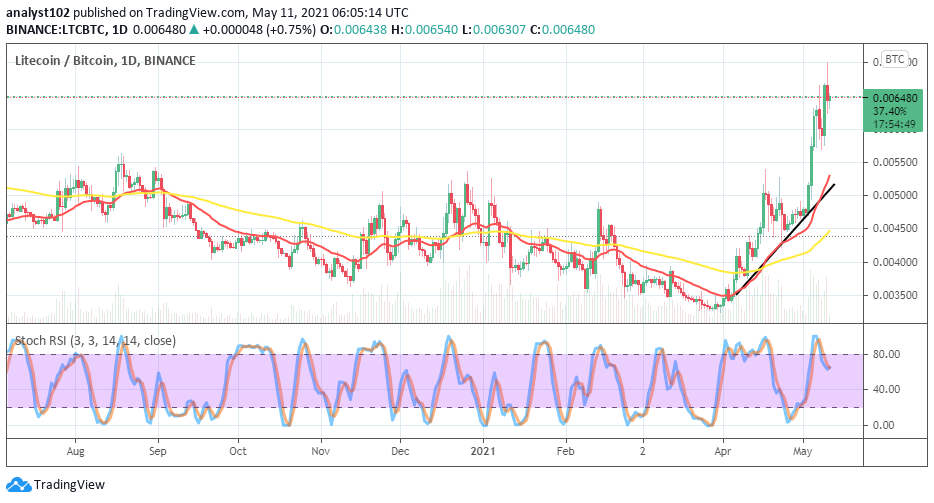
LTC/BTC Price Analysis
The current featuring of bullish candlesticks on the LTC/BTC chart depicts that the base crypto is waxing stronger in its dominance over the counter crypto’s pushes capacity. The 50-day SMA indicator is underneath the 14-day SMA trend-line as they both point strongly to the north direction far below the level that the base instrument has pushed. The Stochastic Oscillators have briefly out of the overbought region. But, they are now attempting to pointing back to the north. That probably means that the base trading tool has not done in its quest for more upsides as paired with its counter instrument.
Note: cryptosignals.org is not a financial advisor. Do your research before investing your funds in any financial asset or presented product or event. We are not responsible for your investing results.