Litecoin (LTC/USD) Trade Experiences Difficulties at $140
Estimated Reading Time: 3 minutes
Don’t invest unless you’re prepared to lose all the money you invest. This is a high-risk investment and you are unlikely to be protected if something goes wrong. Take 2 minutes to learn more
Litecoin Price Prediction – July 30
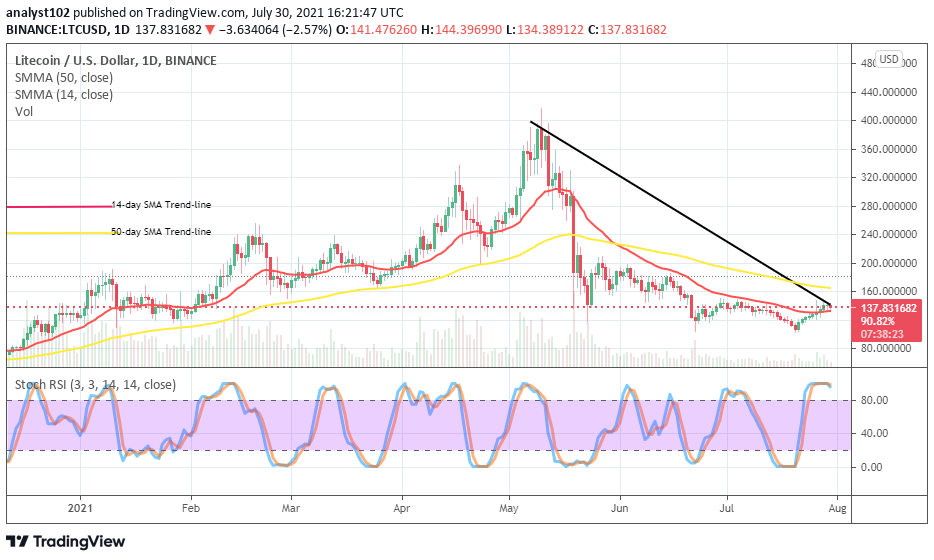
The LTC/USD trade experiences difficulties around the level of $140. The crypto market’s valuation stands at about $138 at a negative percentage rate of about 2.43.
LTC/USD Market
Key Levels:
Resistance levels: $160, $200, $240
Support levels: $120, $100, $80
LTC/USD – Daily Chart
The LTC/USD daily chart as of writing has it that the crypto trade experiences difficulties to push past the line at $140. The crypto trade is still wallowing in struggle around the point until the present. The Stochastic Oscillators are in the overbought region with conjoined lines. The 14-day SMA indicator is underneath the 50-day SMA indicator. The bearish trend-line is drawn southward across the bigger SMA to touch the current trading point over the smaller SMA. There could be long-featuring smaller candlesticks in the ranges of $120 and $160, while the two pairing instruments cannot form a lengthy body.
Crypto trade experiences difficulties around $140; would there be a need for traders to hold off a while?
Traders may need to hold off for a while to a definite direction that price tends to choose as the crypto trade experiences difficulties around $140 presently. Two range trading points have seen at $120 and $160 that variant smaller-ups and smaller-downs could continually emerge during the near sessions. Therefore, bulls would have to be on the lookout for pull-downs that eventually allow active rebounding motion before considering entering a long order. Breaking out at the upper range line may not be achieved very soon.
On the downside, it portends by the weight-measuring tool that the crypto market’s energy to push against the US Dollar has reduced. Hence, the price experiences difficulties around the point of $140. In the wake of that, bears would have to exert forces around a mid-point of the range-values or near the upper range line to get decent cell entry. The presumed downward movement may not surpass the previous lower line. If that assumption plays out, another one of the best times to re-invest and, to launch buy orders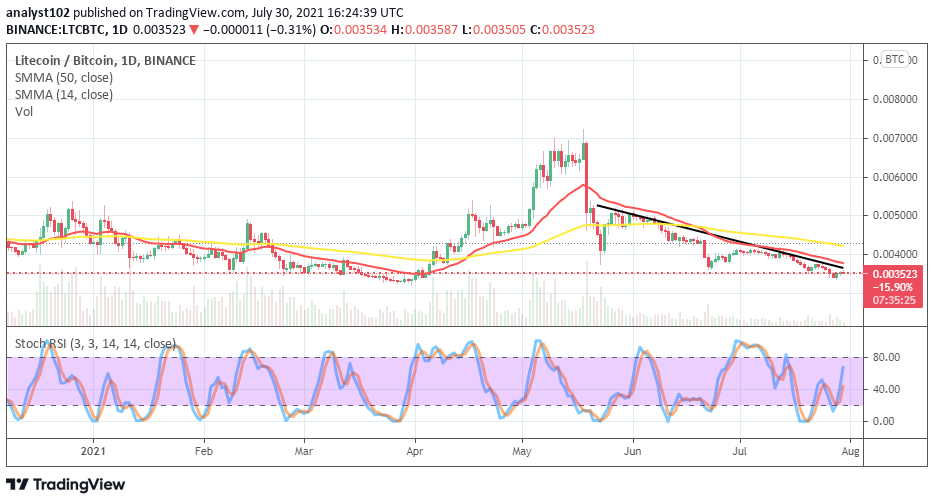
LTC/BTC Price Analysis
The LTC/BTC price analysis chart shows that the trending power of the base crypto is relatively been depreciating, as compared with the flagship counter crypto. Litecoin’s price experiences difficulties with the trend lines of the smaller SMA. The 50-day SMA indicator is above the 14-day SMA indicator. The bearish trend-line is drawn alongside the smaller SMA, slightly facing the south. The Stochastic Oscillators have swerved northbound from the range of 20, briefly past the range of 40. That signifies that the base crypto has only been striving to push against the counter trading instrument.
Note: Cryptosignals.org is not a financial advisor. Do your research before investing your funds in any financial asset or presented product or event. We are not responsible for your investing results.
You can purchase crypto coins here. Buy Tokens