Litecoin (LTC/USD) Trade Remains Down
Estimated Reading Time: 3 minutes
Don’t invest unless you’re prepared to lose all the money you invest. This is a high-risk investment and you are unlikely to be protected if something goes wrong. Take 2 minutes to learn more

Free Crypto Signals Channel
Litecoin Price Prediction – March 8
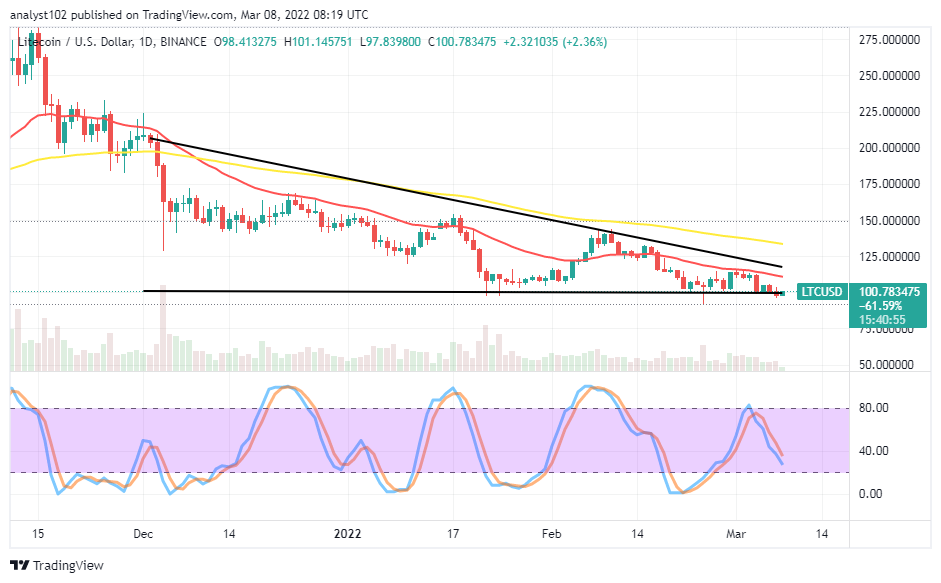
Very less active movements have surfaced over time in the LTC/USD market operations as the crypto-economic trade remains down, finding the southward breaking of the $100 line difficult. The market keeps a positive percentage of 2.36 to trade between $101 and $97 value-lines.
LTC/USD Market
Key Levels:
Resistance levels: $115, $125, $135
Support levels: $100, $95, $85
LTC/USD – Daily Chart
The LTC/USD daily chart shows the crypto-economic trade remains down in its valuation as the $100 critical support baseline stands tough against easy further breaking down of the price. The bearish trend line drew above the smaller to showcase a descending triangular pattern with the drawing of a horizontal line at the value line mentioned earlier. The Stochastic Oscillators have bent slantingly southbound across ranges close to the range of 20. A tinier bullish candlestick is in the making, denoting a promissory upside moving mode in the near time.
Is it psychologically wise to follow the trend down after the $100 as the LTC/USD trade remains down over time?
It doesn’t speak well that traders follow the trend to the downside after the $100 level as the LTC/USD trade remains down over a couple of sessions until the present. Several attempts have been to breach the value-line but to no avail. And that has made the situation more suitable for taking a long order whenever price pushes around it. Long-term intending investors may leverage it to consider coming in around the value line.
On the downside of the technical analysis, the LTC/USD market short-position placers may have to suspend taking further shorting positions around the $100 trading level. If the market will maintain its downward motion continuation, price has to embark on a rallying movement. The crypto economy can push higher resistances such as $115 or 125 to dowse the downward forces.
LTC/BTC Price Analysis
In comparison, the technical trading outlook on the price analysis chart showcases Litecoin trades under a falling force as with Bitcoin over some sessions until now. The cryptocurrency pair trade remains down beneath the trend lines of the SMAs. The bearish channel trend lines drew intently to enclose all the trading happenings in the duo cryptos. The Stochastic Oscillators are a bit over the range of 80 into the overbought region, attempting to cross the lines southbound. That signifies the base crypto may still go under as juxtaposed with the flagship countering crypto in the subsequent operations.
Note: Cryptosignals.org is not a financial advisor. Do your research before investing your funds in any financial asset or presented product or event. We are not responsible for your investing results.
You can purchase Lucky Block here. Buy LBlock: