Lucky Block Price Prediction: LBLOCK/USD Begins the Upward Movement
Estimated Reading Time: 2 minutes
Don’t invest unless you’re prepared to lose all the money you invest. This is a high-risk investment and you are unlikely to be protected if something goes wrong. Take 2 minutes to learn more
Lucky Block Price Prediction – July 13
The Lucky Block price prediction reveals that the bulls begin to increase their momentum as the price heads to the upside.
LBLOCK/USD Medium-term Trend: Ranging (1D Chart)
Key Levels:
Resistance levels: $0.000170, $0.00180, $0.000190
Support levels: $0.000060, $0.000050, $0.000040
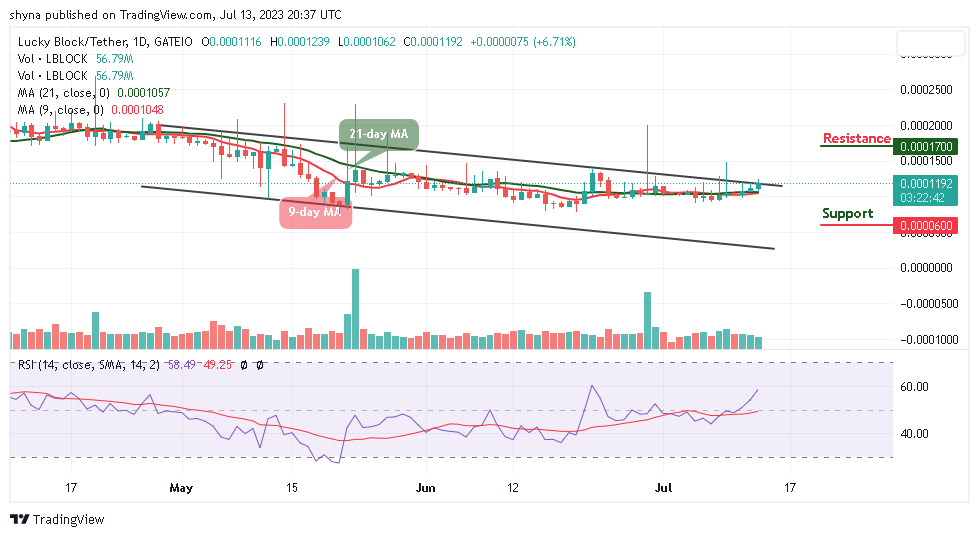
At the time of writing, LBLOCK/USD is moving bullishly as the coin hovers above the 9-day and 21-day moving averages, aiming to cross above the upper boundary of the channel. However, if the bulls fail to drive the price higher, the Lucky Block price could consolidate within a little time before heading to the north.
Lucky Block Price Prediction: LBLOCK/USD Will Spike to the Upside
The Lucky Block price is at the moment changing hands at $0.000119 where it will make a cross above the channel. As soon as the coin crosses above this barrier, it will locate the potential resistance levels at $0.000170, $0.000180, and $0.000190 while the support levels could be found at $0.000060, $0.000050, and $0.000040 for the new entries while the technical indicator Relative Strength Index (14) is moving to cross above the 60-level.
LBLOCK/USD Medium-term Trend: Ranging (4H Chart)
The Lucky Block price keeps moving above the 9-day and 21-day moving averages to touch the resistance level of $0.000120. The technical indicator Relative Strength Index (14) is within the overbought region as the coin prepares for upward movement. Therefore, any bullish movement above the upper boundary of the channel could reach the resistance level at $0.000130 and above.
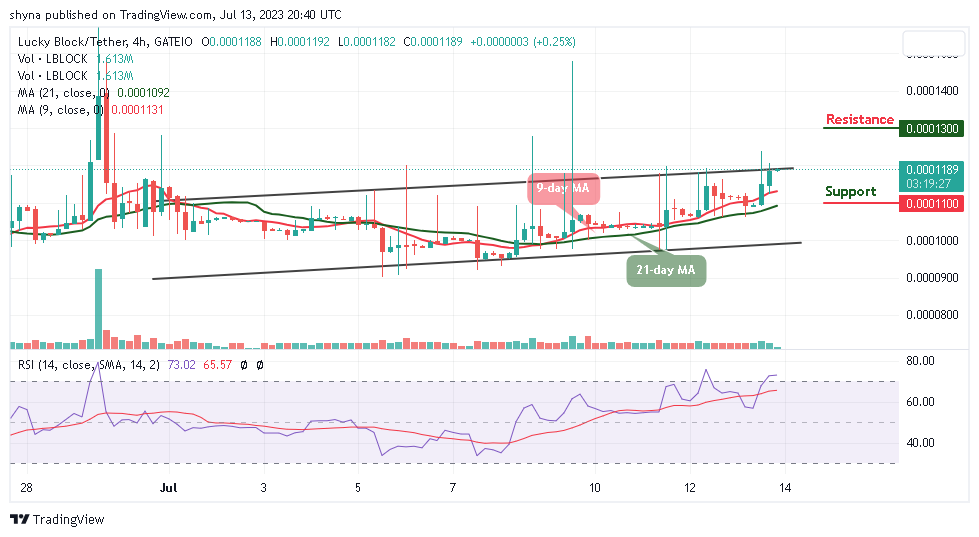
Moreover, LBLOCK/USD will continue to display some bullish signals if the bulls increase the pressure. Once this takes place, the market price will create additional gains, but if the price drops and crosses below the moving averages, it could touch the nearest support at $0.000110 and below.
You can purchase Lucky Block here. Buy LBLOCK