Lucky Block Price Prediction: LBLOCK/USD Bounces Above $0.00040
Estimated Reading Time: 3 minutes
Don’t invest unless you’re prepared to lose all the money you invest. This is a high-risk investment and you are unlikely to be protected if something goes wrong. Take 2 minutes to learn more

Free Crypto Signals Channel
The daily chart reveals that the Lucky Block price faces the upside as traders set to reclaim the $0.00042 resistance level.
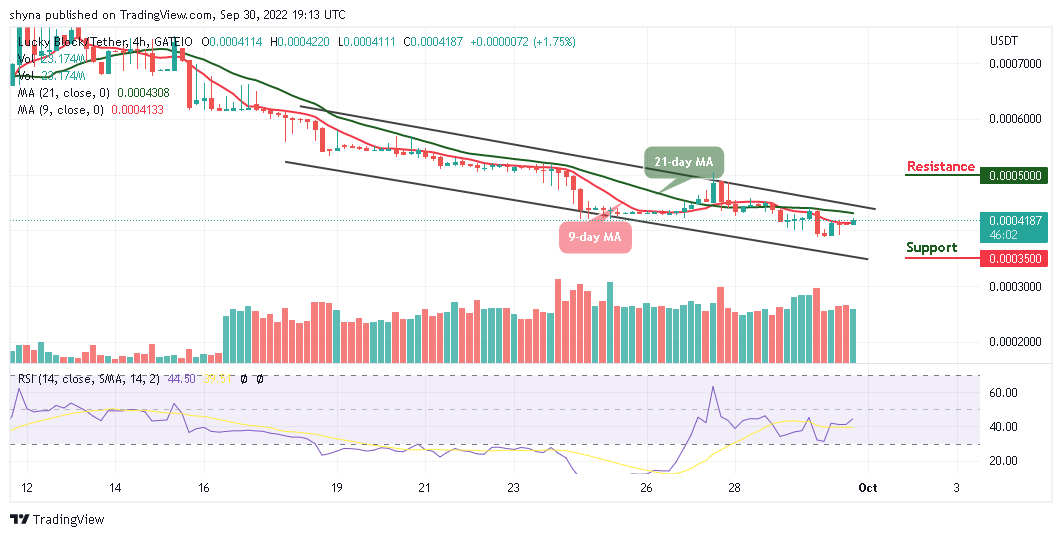
LBLOCK/USD Long-term Trend: Ranging (4H Chart)
Key Levels:
Resistance levels: $0.00050, $0.00055, $0.00060
Support levels: $0.00035, $0.00030, $0.00025
At the time of writing, LBLOCK/USD is heading to the upside as the coin faces potential resistance at the $0.00045 level. A break above the 21-day moving average will produce a huge green candle towards the upper boundary of the channel, which could hit the resistance levels at $0.00050, $0.00055, and $0.00060 respectively.
Lucky Block Price Prediction: LBLOCK Price Moves to the Upside
The Lucky Block price is moving bullishly as the coin crosses above the 9-day MA, facing the 21-day MA. On the contrary, if the coin heads to the downside, it could bring the market price towards the lower boundary of the channel which could hit the supports at $0.00035, $0.00030, and $0.00025, giving room for the new buyers to enter. Moreover, the technical indicator Relative Strength Index (14) is moving to cross above the 40-level, suggesting bullish movement.
LBLOCK/USD Medium-term Trend: Bearish (1H Chart)
The Lucky Block price is changing hands above the 9-day and 21-day moving averages. As it is now, there’s a low amount of buying pressure in the market, which is why the market price could not gain more upside for now. The coin can become cheaper so that the existing can buy more and the new buyers can come into the market.
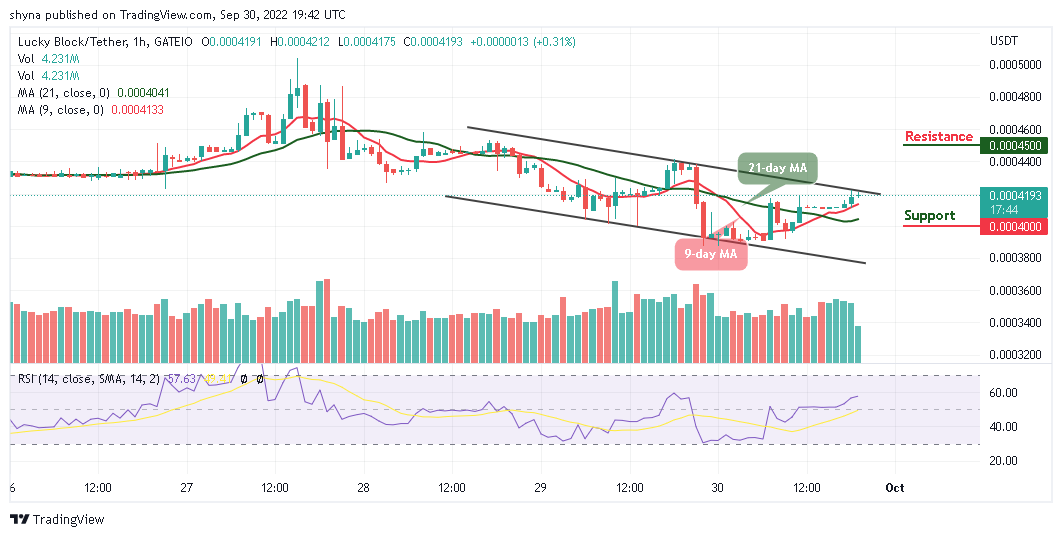
Moreover, if bears bring the price below the 9-day moving average, traders would expect the market to touch the support level of $0.00040 and below. Meanwhile, a bullish continuation would push the price above the upper boundary of the channel which could cause the coin to hit the resistance level of $0.00045 and above while the technical indicator Relative Strength Index (14) moves to cross above the 60-level.
You can purchase Lucky Block here. Buy LBLOCK