Lucky Block Price Prediction: LBLOCK/USD Gradually Maintaining the Upward Trend
Estimated Reading Time: 2 minutes
Don’t invest unless you’re prepared to lose all the money you invest. This is a high-risk investment and you are unlikely to be protected if something goes wrong. Take 2 minutes to learn more

Free Crypto Signals Channel
The daily chart shows that the upward direction of the Lucky Block price prediction is revealing as the bull gains momentum.
LBLOCK/USD Market
Key Levels:
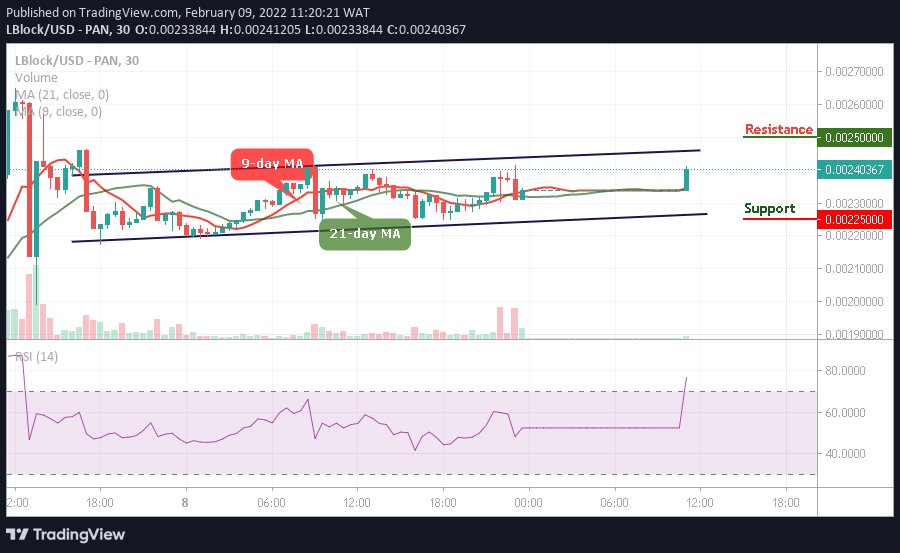
Resistance levels: $0.00250, $0.00255, $0.00260
Support levels: $0.00225, $0.00220, $0.00215
LBLOCK/USD gradually maintains an uptrend as market volume increases. However, a push may shoot the price to cross above the upper boundary of the channel, where the resistance level of $0.00240 could be located. More so, the Lucky Block price may continue in the channel pattern until a price breakout above the channel comes to play.
Lucky Block Price Prediction: LBLOCK/USD Ready for The Upside
A fall-back-formation below the 9-day and 21-day moving averages could bring the Lucky Block price to the support levels of $00.225, $0.00220, and $0.00215. On the other hand, considering a continuous upward trend for this coin, LBLOCK/USD could surge towards the resistance levels of $0.00250, $0.00255, and $0.00260 on a long-term bullish. Meanwhile, the technical indicator Relative Strength Index (14) is looking bullish at the moment as the signal line moves above the overbought region.
LBLOCK/USD Medium-term Trend: Bullish (15 Minutes Chart)
Looking at the 15-minute chart, the pair moves to hit the resistance level of $0.00265 and currently trading above the 9-day and 21-day moving averages at $0.00264. However, as the bulls push the coin to create a new higher level, LBLOCK/USD may touch the potential resistance levels of $0.00270 and above.
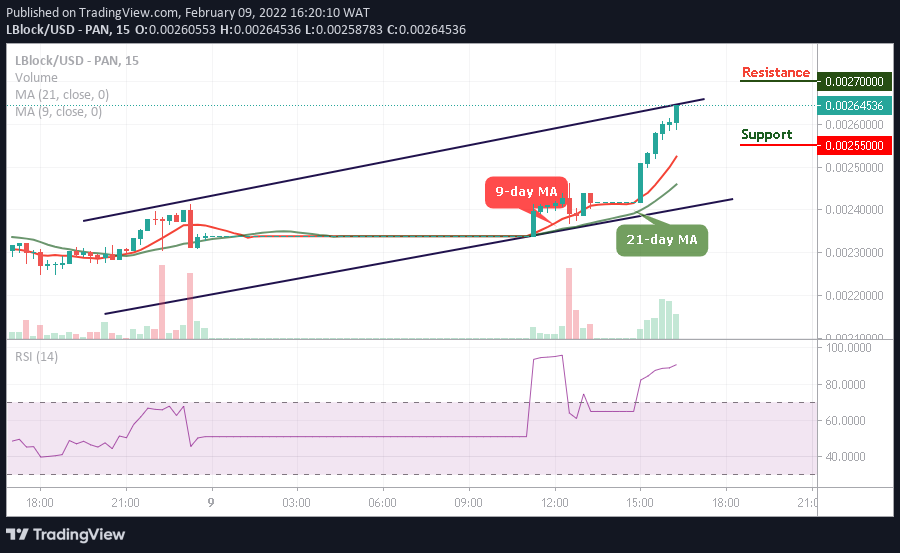
Moreover, as the Relative Strength Index (14) stays within the overbought region, the buyers are expected to buy long as the coin prepares to break higher. In other words, the new buyers are to come into the market if the Lucky Block price retreats and hits the support level of $0.00250 and below.
Read more: