Lucky Block Price Prediction: LBLOCK/USD Ranges As Price Gets Ready to Spike
Estimated Reading Time: 2 minutes
Don’t invest unless you’re prepared to lose all the money you invest. This is a high-risk investment and you are unlikely to be protected if something goes wrong. Take 2 minutes to learn more

Free Crypto Signals Channel
The Lucky Block price prediction reveals that if bulls begin to increase their momentum, the price would cross above the moving averages.
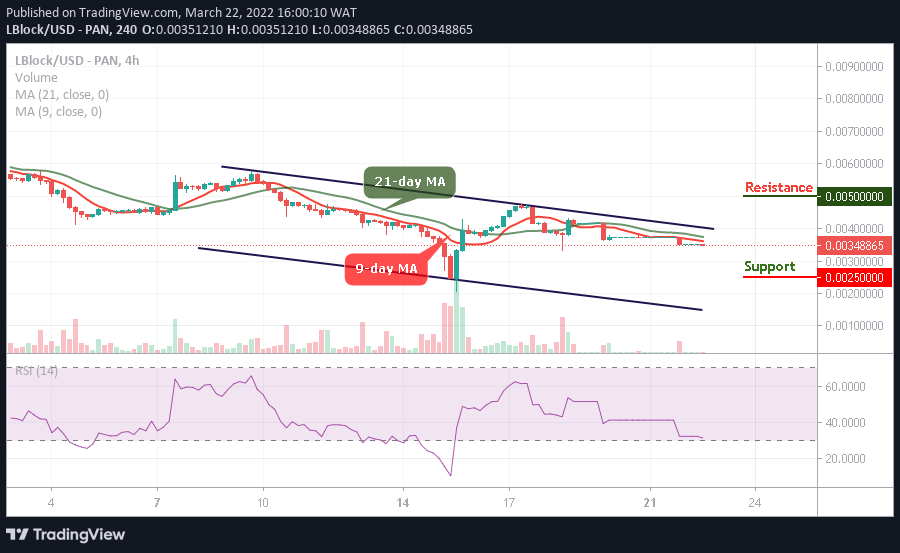
LBLOCK/USD Medium-term Trend: Ranging (4H Chart)
Key Levels:
Resistance levels: $0.0050, $0.0055, $0.0060
Support levels: $0.0025, $0.0020, $0.0015
At the time of writing, LBLOCK/USD is moving sideways as the coin prepares to break above the 9-day and 21-day moving averages. Meanwhile, the bullish momentum is propelling the coin above the $0.0030 resistance level as bullish pressure could break the $0.0035 level. However, if the bulls fail to drive the price higher, the Lucky Block price could consolidate for some time.
Lucky Block Price Prediction: LBLOCK/USD Would Shoot to the Upside
The Lucky Block price is changing hands at $0.0034 where it will begin to face the upside. However, if the coin continues the upward movement above the 9-day and 21-day moving averages, the coin may locate the potential resistance levels at $0.0050, $0.0055, and $0.0060 while the support levels remain at $0.0025, $0.0020, and $0.0015 for the new entries while the technical indicator Relative Strength Index (14) moves around 30-level.
LBLOCK/USD Medium-term Trend: Ranging (2H Chart)
The Lucky Block price moves below the 9-day and 21-day moving averages range-bounding. The technical indicator Relative Strength Index (14) is within the oversold region as the coin may begin the upward movement. However, any bullish movement above the moving averages may reach the resistance level at $0.0045 and above.
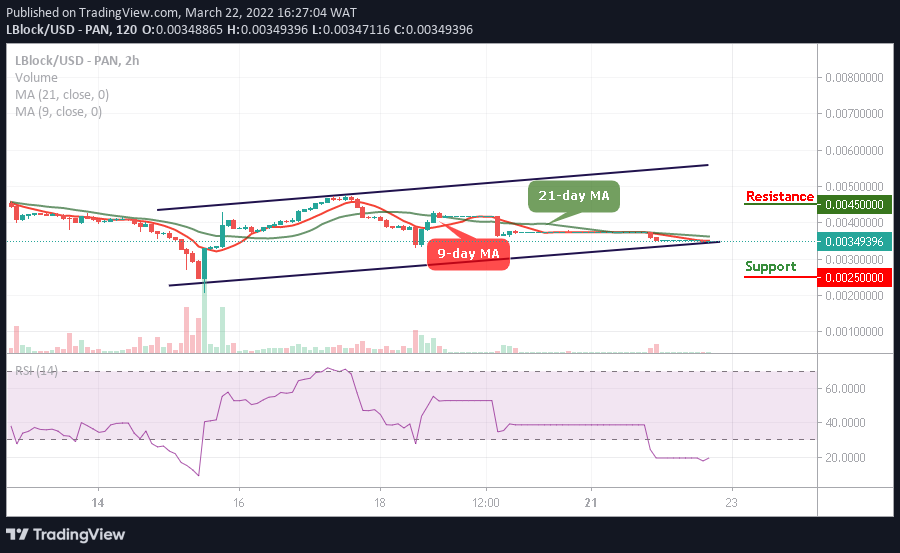
Nevertheless, LBLOCK/USD may begin to display some bullish signals, and once this happens, the market price may head to the upside, but if the price drop below the lower boundary of the channel, it could touch the nearest support at $0.0025 and below.
Read more: