Sponge/USD ($SPONGE) Shows Promise of Rebounding at $0.00009, Amidst Persistent Bearish Pressure
Estimated Reading Time: 3 minutes
Don’t invest unless you’re prepared to lose all the money you invest. This is a high-risk investment and you are unlikely to be protected if something goes wrong. Take 2 minutes to learn more
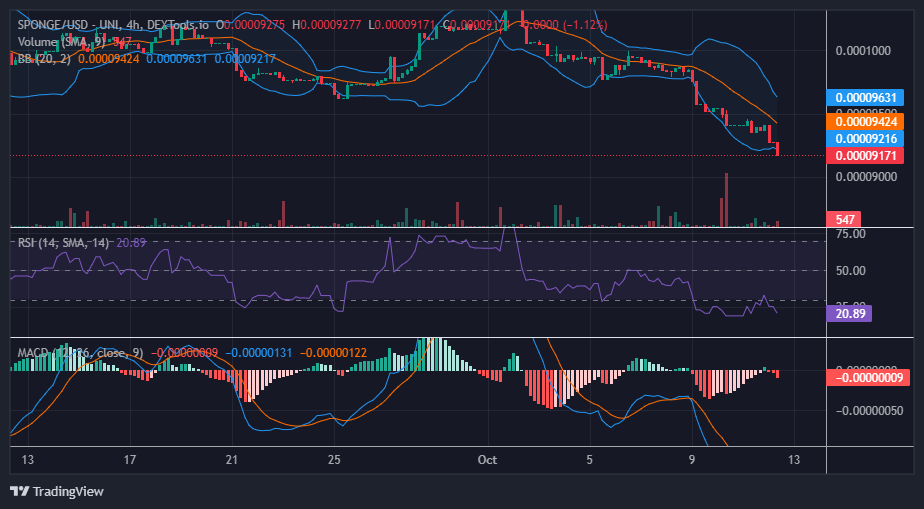
Contrary to the anticipated rebound at the $0.000094 price level outlined in the previous market analysis, the SPONGE/USD price has instead descended to a fresh low, approaching the $0.00009 threshold. This bearish intrusion into what was previously bullish territory presents an opportune moment for traders to consider ‘buying the dip, with the prospect of optimizing profits when the market regains its upward momentum. It’s plausible that some traders are exercising patience, awaiting the market’s arrival at this pivotal juncture, before actively participating in the resurging bull market.
Key Levels
Resistance: $0.000115, $0.000120, and $0.000125.
Support: $0.000090, $0.000080, and $0.000085.
Sponge (SPONGE/USD) Price Analysis: Insights from Technical Indicators
Based on the analysis of key indicators, the market has entered a state of substantial overselling, with prices falling below their intrinsic value. Typically, under such circumstances, a rebound is anticipated. However, recent developments have seen the bear market persistently expand its influence, resulting in the breach of new lows.
Nonetheless, as the SPONGE/USD price approaches the $0.00009 price level, the conditions are primed for a potential rebound. It is conceivable that traders are strategically exercising patience, waiting for the market to reach this crucial threshold before executing long positions.
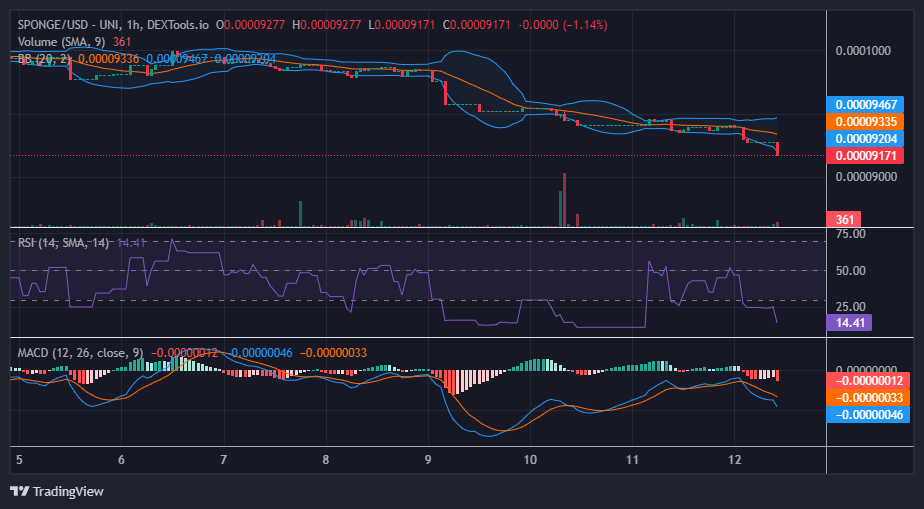
$SPONGE Short-Term Outlook: 1-Hour Chart
Analysis based on the 1-hour chart reveals significant insights from the Bollinger Bands. Notably, the lower band exhibits divergence from the recent price action, with prices extending beyond the lower band’s boundary. This divergence is a compelling signal indicating that the market has entered an oversold condition.
While the recent price movements have leaned bearish, it is important to acknowledge the potential unsustainability of this trend. The prevailing bearish pressure, responsible for pushing the market into an oversold region, has reached an intensity that could prompt a noteworthy price breakout. This impending breakout has the potential to reverse the prevailing bearish sentiment, offering opportunities for traders to capitalize on the subsequent price movement.
Season 1 of the SPONGE/USD Airdrop is about to conclude. Entry deadline is October 30, 2023.
Important reminder, #SPONGERS! 🚀
🧽 $SPONGE #Airdrop season 1 is ending soon! Entries close on 30th October, 2023 🌊
It’s not too late to absorb the damp 🧽💦
Learn how to enter by clicking the link!
👉 https://t.co/lzRhjW4oLL pic.twitter.com/tYroFfpIkN— $SPONGE (@spongeoneth) October 12, 2023
Invest in the hottest and best meme coin. Buy Sponge ($SPONGE) today!