SPONGE/USD ($SPONGE) Price Rallies From the $0.000094 Price Level
Estimated Reading Time: 3 minutes
Don’t invest unless you’re prepared to lose all the money you invest. This is a high-risk investment and you are unlikely to be protected if something goes wrong. Take 2 minutes to learn more
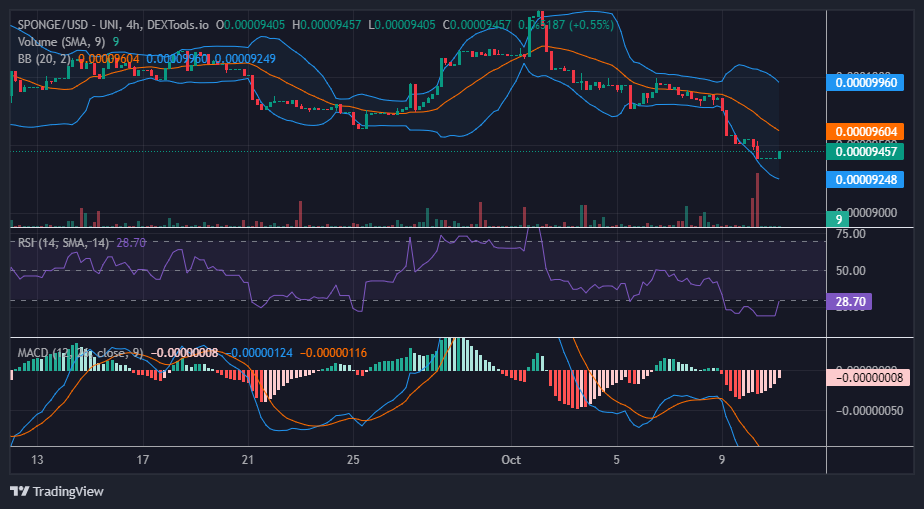
Persistent selling pressure has compelled the bull market to dip below the anticipated $0.000096 price threshold. Initially, market analysis based on historical data suggested the possibility of a rebound occurring at this level. Nonetheless, owing to the unyielding bearish sentiment, the $SPONGE market had to seek firmer support at $0.000094. Consequently, a noteworthy price rebound has emerged from this new base.
Key Levels
- Resistance: $0.000115, $0.000120, and $0.000125.
- Support: $0.000090, $0.000080, and $0.000085.
Sponge (SPONGE/USD) Price Analysis: Insights from Technical Indicators
Currently, there is a notable shift as bearish sentiment encroaches further into what were previously bullish territories. However, key indicators provide a compelling rationale to anticipate a potential market shift in favor of the bulls. When examining the market through the lens of the Relative Strength Index (RSI) and the Moving Average Convergence and Divergence (MACD) indicator, it becomes evident that the market has resided within overbought territory since October 9. This signal suggests the likelihood of an upward price correction. Furthermore, in conjunction with the fact that the price has dipped below the previous $SPONGE support level, this development may incentivize a surge in buying activity as investors seek to capitalize on the price dip.
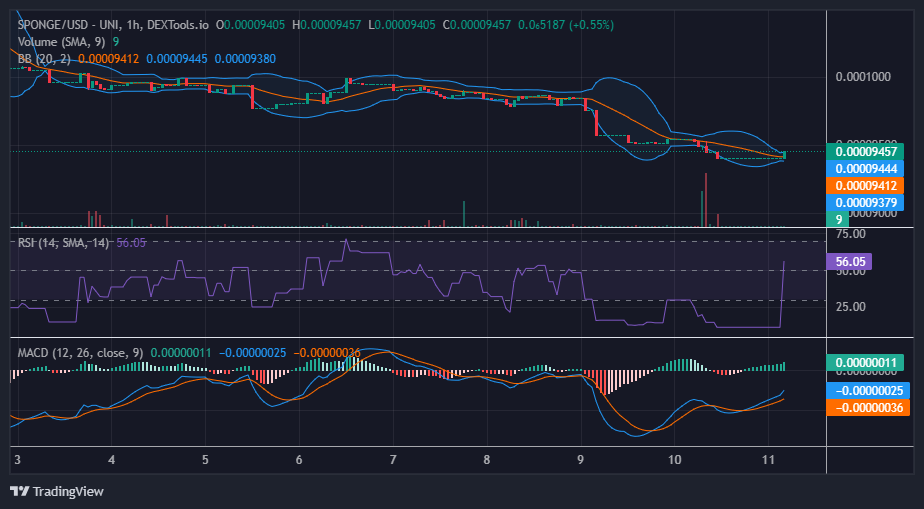
$SPONGE Short-Term Outlook: 1-Hour Chart
In the 1-hour timeframe, a robust bullish recovery is evident, with the price having entered bullish territory. The Relative Strength Index (RSI) registers a momentum level of 56, indicating favorable market momentum. The current 1-hour session is represented by a promising bullish candlestick. Moreover, the convergence of the Bollinger Bands suggests the potential for the $SPONGE bullish recovery to persist.
The first phase of the SPONGEUSD airdrop is still ongoing until November; be ready to secure your spot.
🧽💥 Ready to secure your position on the $SPONGE #Airdrop rankings? 🚀🔝
📅 As Season 1 approaches its finale, excitement levels are soaring! 🌟🧽
💱 Elevate your ranking with #Hodling and trading $SPONGE #Tokens! 💪💰
🔗 https://t.co/lzRhjW4oLL pic.twitter.com/VD9XPO2yIy
— $SPONGE (@spongeoneth) October 11, 2023
Invest in the hottest and best meme coin. Buy Sponge ($SPONGE) today!