Bitcoin Price Prediction: BTC/USD Looks for a Direction Above $62,000
Estimated Reading Time: 3 minutes
Don’t invest unless you’re prepared to lose all the money you invest. This is a high-risk investment and you are unlikely to be protected if something goes wrong. Take 2 minutes to learn more
Bitcoin (BTC) Price Prediction – May 9
The Bitcoin price prediction gains 1.86% as bulls keep working hard on BTC to nurture a bullish trend toward the resistance level of $65K.
BTC/USD Long-term Trend: Bearish (Daily Chart)
Key levels:
Resistance Levels: $75,000, $77,000, $79,000
Support Levels: $49,000, $47,000, $45,000
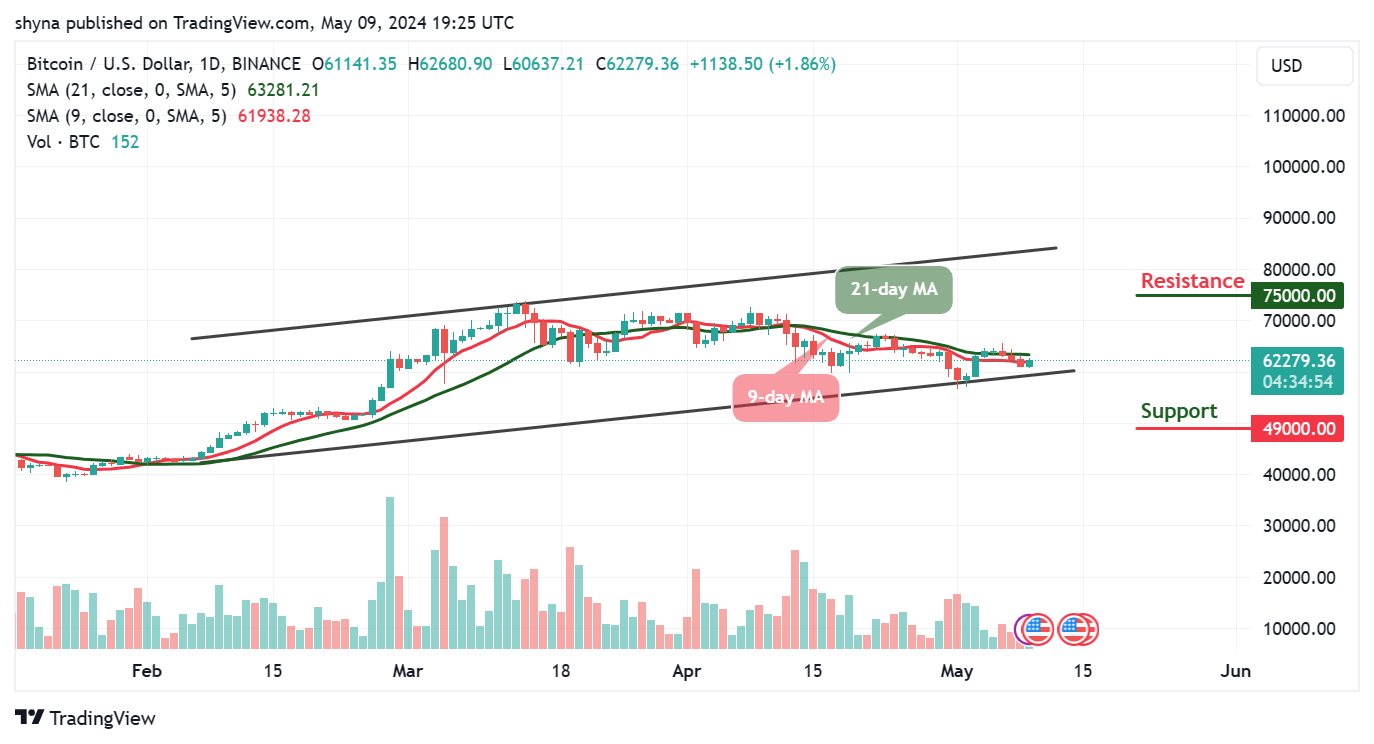
BTC/USD is hovering at the $62,279 resistance level as the market price moves to cross above the 9-day and 21-day moving averages to indicate a bullish movement. For the past few days, the Bitcoin price has been moving negatively, and it is likely to retest the support level of $60,000 before heading to the north.
Bitcoin Price Prediction: Will BTC Break Above $65k?
If the Bitcoin price can cross above the resistance level of $63,000, the market price will likely touch the potential resistance of $65,000 level. This is where traders should expect buyers to fight for a further rise in BTC/USD and further development of the bullish trend. Meanwhile, looking at the market movement, it is likely that the Bitcoin price may experience a quick retracement or sell-off just in case it touches the crucial $63,000 resistance level.
However, any further bullish movement could hit the resistance level of $75,000, $77,000, and $79,000 respectively. On the downside, if the market decides to cross below $60,000 support, BTC/USD may cross below the lower boundary of the channel, and if that support fails to hold the sell-off, the Bitcoin price could see a further decline toward the support levels of $49,000, $47,000, and $45,000.
BTC/USD Medium-term Trend: Ranging (4H Chart)
On the 4-hour chart, the Bitcoin price is ranging and it could cross above the upper boundary of the channel if the bullish pressure increases. On the contrary, if the selling pressure returns to the market and the coin does not follow the upward movement, the $57,000 and below may come into play.
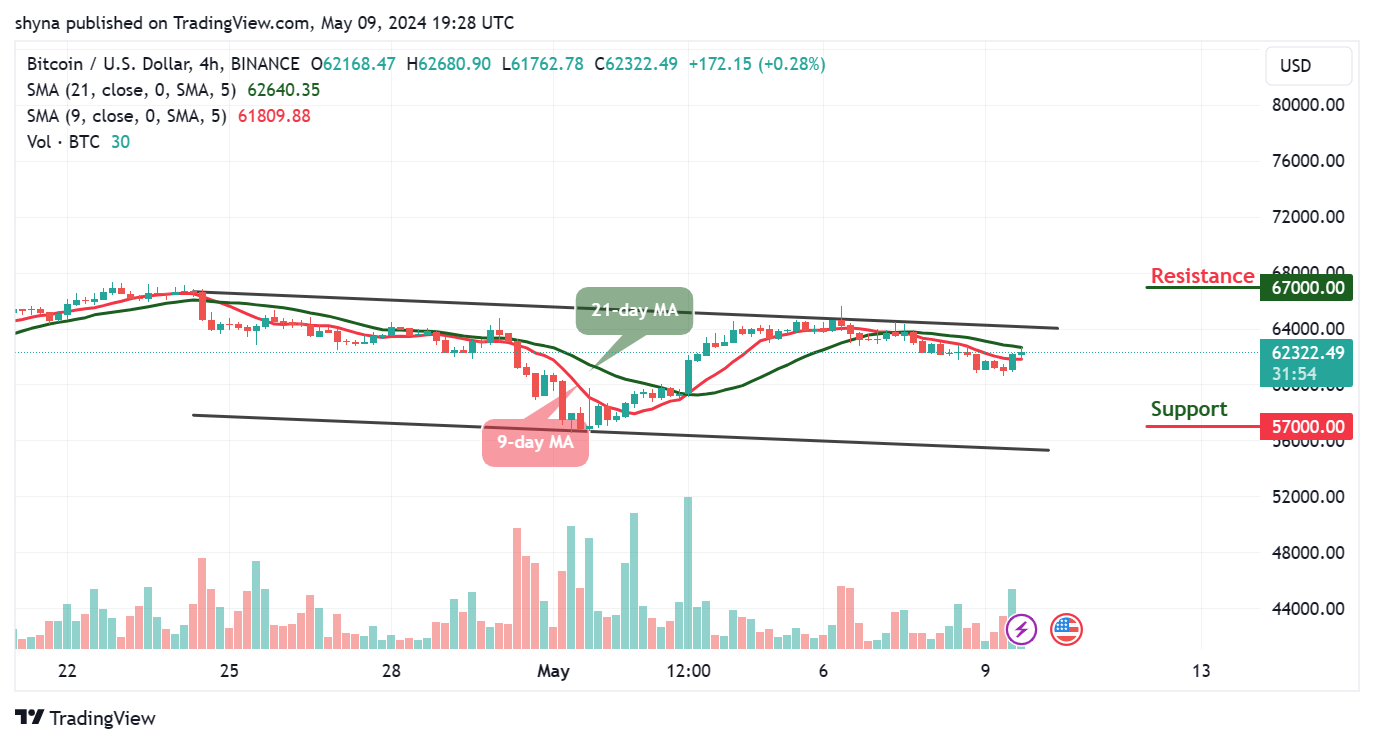
However, if the buyers can push the price above the 21-day moving average, traders may expect a strong bullish movement above the upper boundary of the channel that could hit the resistance at $67,000 and above. Meanwhile, the 9-day MA is below the 21-day MA, suggesting that more bearish signals may play out.
You can purchase Bitcoin here. Buy BTC