Bitcoin Price Prediction: BTC/USD Surpasses $66,000: Is it Time for an Upsurge?
Estimated Reading Time: 3 minutes
Don’t invest unless you’re prepared to lose all the money you invest. This is a high-risk investment and you are unlikely to be protected if something goes wrong. Take 2 minutes to learn more
Bitcoin (BTC) Price Prediction – April 22
Looking at the daily chart, the Bitcoin (BTC) price prediction is showing positive signs, and it is likely to accelerate further higher in the near term.
BTC/USD Long-term Trend: Bullish (Daily Chart)
Key levels:
Resistance Levels: $80,000, $82,000, $84,000
Support Levels: $52,000, $50,000, $48,000
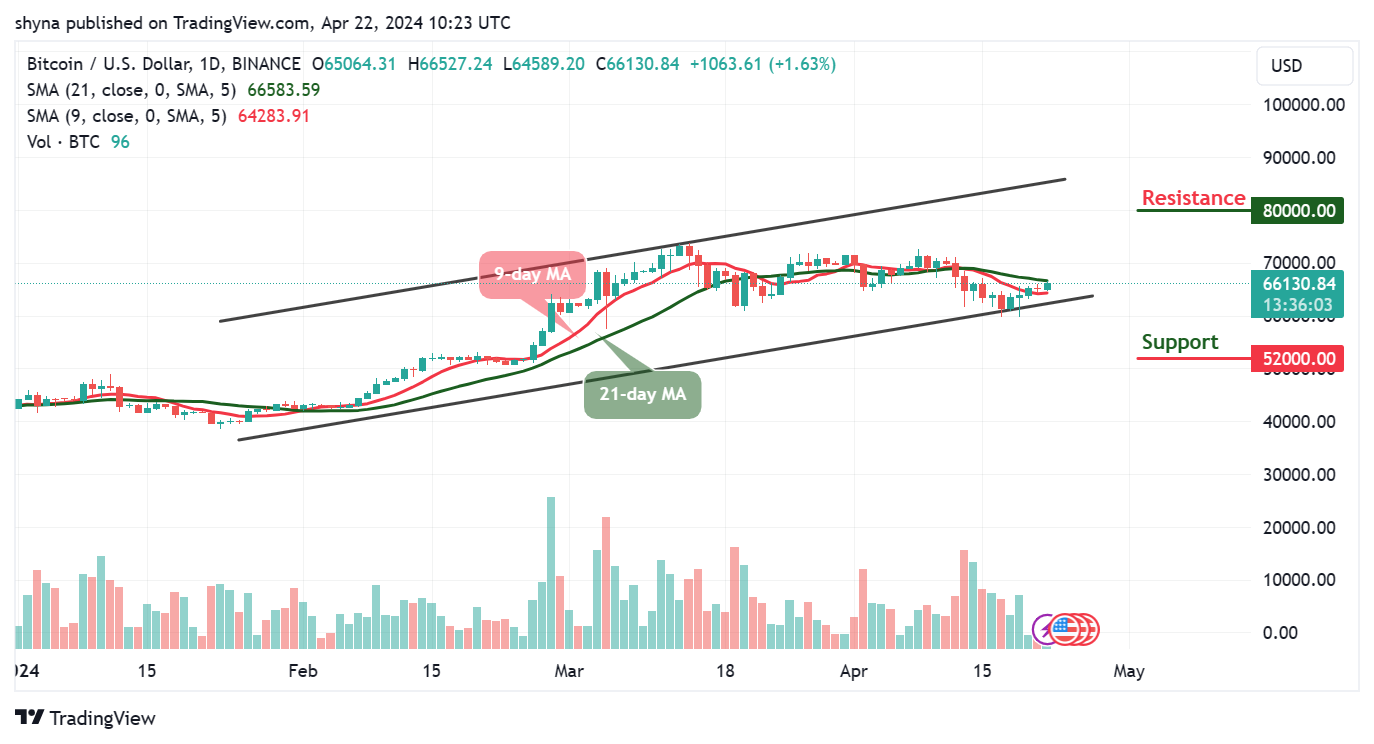
According to the daily chart, BTC/USD breaches $66,000 as the new week’s high beckons. The king coin is seen trading well within the 9-day and 21-day moving averages at $66,130. Moreover, the Bitcoin price is within touching distance of forming a new daily high above the previous high of $66,000, which is quite remarkable.
Bitcoin Price Prediction: Where is Bitcoin Price Going Next?
At the moment, the Bitcoin price is trading comfortably toward the upper boundary of the channel as the price establishes a new bullish signal. Meanwhile, one could say that the long-term outlook favors the bulls, giving the daily close produced a few bullish candles with eyes now set on the daily resistances at $80,000, $82,000, and $84,000 respectively.
Meanwhile, any drop from the current level could lead to declines in the critical support below the lower boundary of the channel. However, in case BTC drops and touches the low of $60,000 support, then the king coin can rely on the long-term support levels at $52,000, $50,000, and $48,000. Moreover, the 9-day moving average is below the 21-day moving average, suggesting bearish signals.
BTC/USD Medium-term Trend: Ranging (4H Chart)
According to the 4-hour chart, the Bitcoin price is seen trading above the 9-day and 21-day moving averages at $66,132. However, today’s price move could be impressive if it climbs above the long-awaited resistance level of $70,000. Moreover, BTC/USD is now maintaining its bull run as the 9-day MA keeps hovering above the 21-day MA.
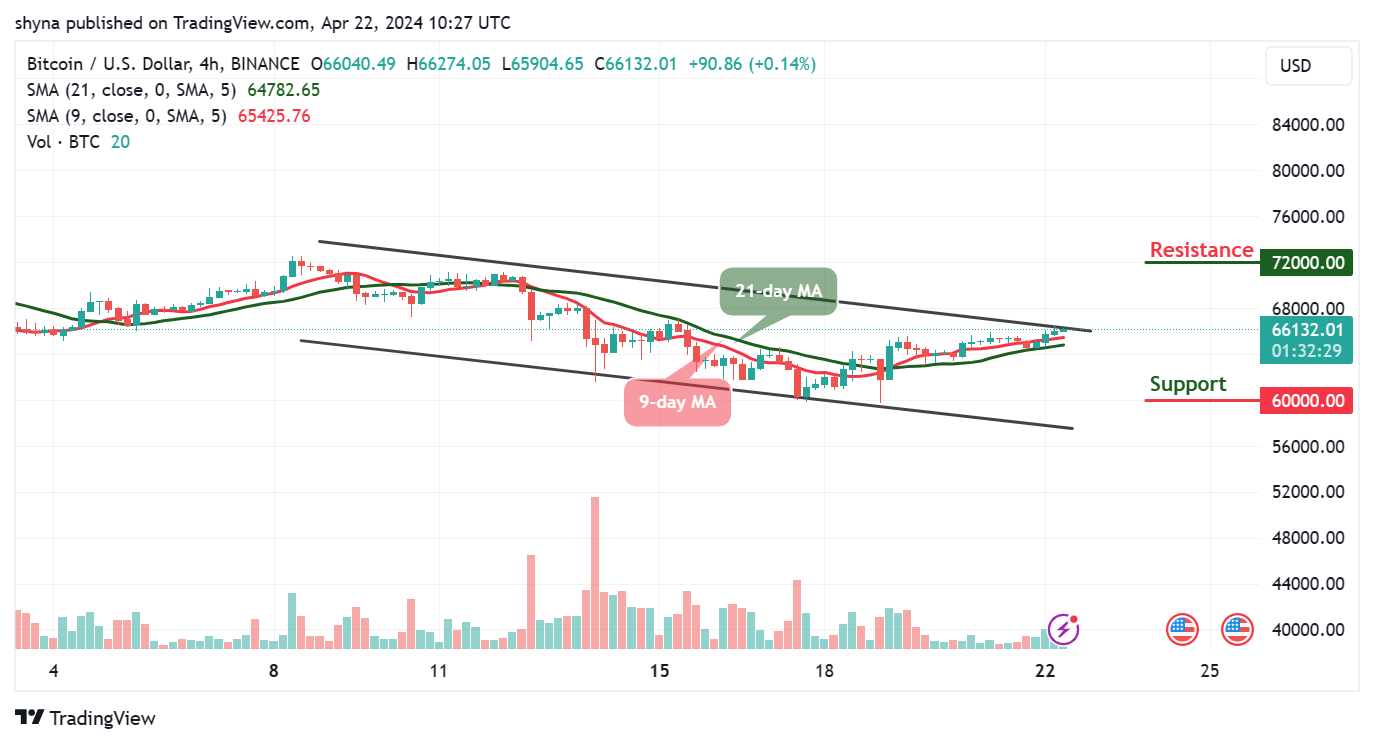
On the contrary, BTC may take a downward move if the bulls fail to push the price higher, and the coin may breach below the 9-day and 21-day moving averages, which could reach another support at $60,000 and below. Nevertheless, if the bulls find a decent resistance level of around $68,000, the coin may continue the bullish movement by crossing above the channel to hit the resistance level of $72,000 and above.
You can purchase Bitcoin here. Buy BTC