Chainlink (LINK/USDT) Shows Weakness Amid Weekly Reversal Setup
Estimated Reading Time: 3 minutes
Don’t invest unless you’re prepared to lose all the money you invest. This is a high-risk investment and you are unlikely to be protected if something goes wrong. Take 2 minutes to learn more

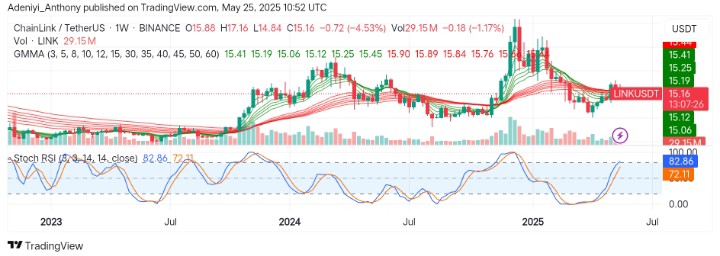
Chainlink long-term Analysis: Ranging
The market for Chainlink against the Tether is drawing attention after a notable pullback in the previous year, as the price seems to be showing a possible trend reversal despite its current performance.
Recently, the pair has been down by over 4%, yet the price remains above key levels even with ongoing market conditions. As it stands, the price appears to be stabilizing above the Guppy Multiple Moving Averages (GMMAs) while the Stochastic RSI points upside, indicating buyers’ confidence.
Currently, Chainlink trades at $15.16, recording 29.15 million traded volumes on the weekly chart.
Technical Indicators
Major Resistance Levels: $17.15, $18.80, and $21.30
Major Support Levels: $13.60, $12.00, and $10.50
Chainlink Technical Analysis
On the weekly timeframe, the analysis of Chainlink against the Tether shows the pair is attempting to break above the long-period EMAs, provided an early trend shift is confirmed by the volume. However, buyers are waiting for a strong movement as the price seems to be struggling with a move above the $15.40 level.
From another angle, the Stochastic oscillator shows the bullish momentum is building, as the lines advance to the north. As it stands, caution is warranted as the volume appears relatively stable. However, if the pair can maintain a hold above the $15.00 level, a move above $17.00 could materialize in the near term; otherwise, the pair might experience further downside.
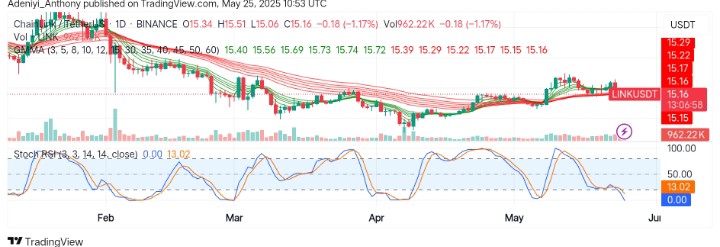
LINK/USDT Analysis: Expectations
On the daily chart, LINK/USDT appears to be stalled at $15.16 with reducing volume and momentum. This hints at indecision after a failed attempt at a break above $15.50. However, the Stochastic has sharply dropped into the oversold region, further suggesting declining bullishness.
From another perspective, the price still hangs above the long-period EMAs, looking very fragile. To this end, a retracement towards $14.20 may be seen in the short term if momentum continues to fall.
You can purchase crypto coins here. Buy LBlock