Lucky Block Price Prediction: LBLOCK/USD Keeps Ranging Around 0.000039
Estimated Reading Time: 3 minutes
Don’t invest unless you’re prepared to lose all the money you invest. This is a high-risk investment and you are unlikely to be protected if something goes wrong. Take 2 minutes to learn more
Lucky Block Price Prediction – February 12
The Lucky Block price prediction shows that LBLOCK is trading at $0.000039 as the coin seems to be preparing for a bullish movement.
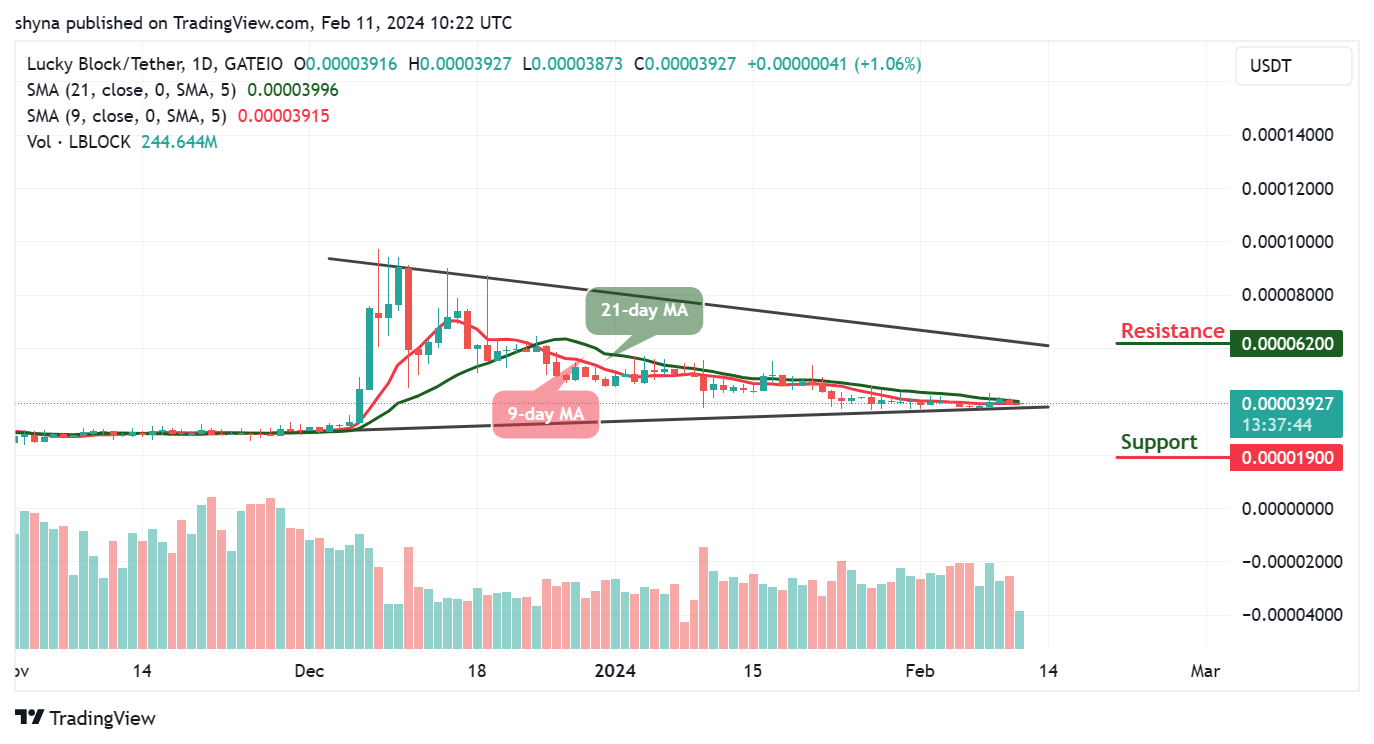
LBLOCK/USD Long-term Trend: Ranging (Daily Chart)
Key levels:
Resistance Levels: $0.000062, $0.000060, $0.000058
Support Levels: $0.000019, $0.000017, $0.000015
At the time of writing, LBLOCK/USD seems to be waiting for an opportunity for a break into the positive side. The coin is trading within the 9-day and 21-day moving averages before heading toward the upper boundary of the channel. However, the Lucky Block price will extend toward the resistance level of $0.000050 if the buyers increase the pressure.
Lucky Block Price Prediction: Is $0.000050 Resistance Coming for LBLOCK?
It is likely for the Lucky Block price to touch the resistance level of $0.000050 as soon as the market price heads toward the north. Any further bullish movement above the upper boundary of the channel may locate the potential resistance levels at $0.000062, $0.000060, and $0.000058. Meanwhile, when the new uptrends are gathering, traders could use the 9-day moving average as a pivot resistance point to gauge the strength of the trend.
On the contrary, if the LBLOCK price fails to move up; traders may see a price cut toward the south, and a further low could bring the price to the support levels at $0.000019, $0.000017, and $0.000015 respectively. For now, the Lucky Block price will begin to rise as the 9-day MA moves to cross above the 21-day MA.
LBLOCK/USD Medium-term Trend: Ranging (4H Chart)
According to the 4-hour chart, the Lucky Block price is moving bullishly as the coin trades at $0.00039. However, the Lucky Block may continue with the bullish movement, if not, the support level of $0.000036 and below may come into focus.
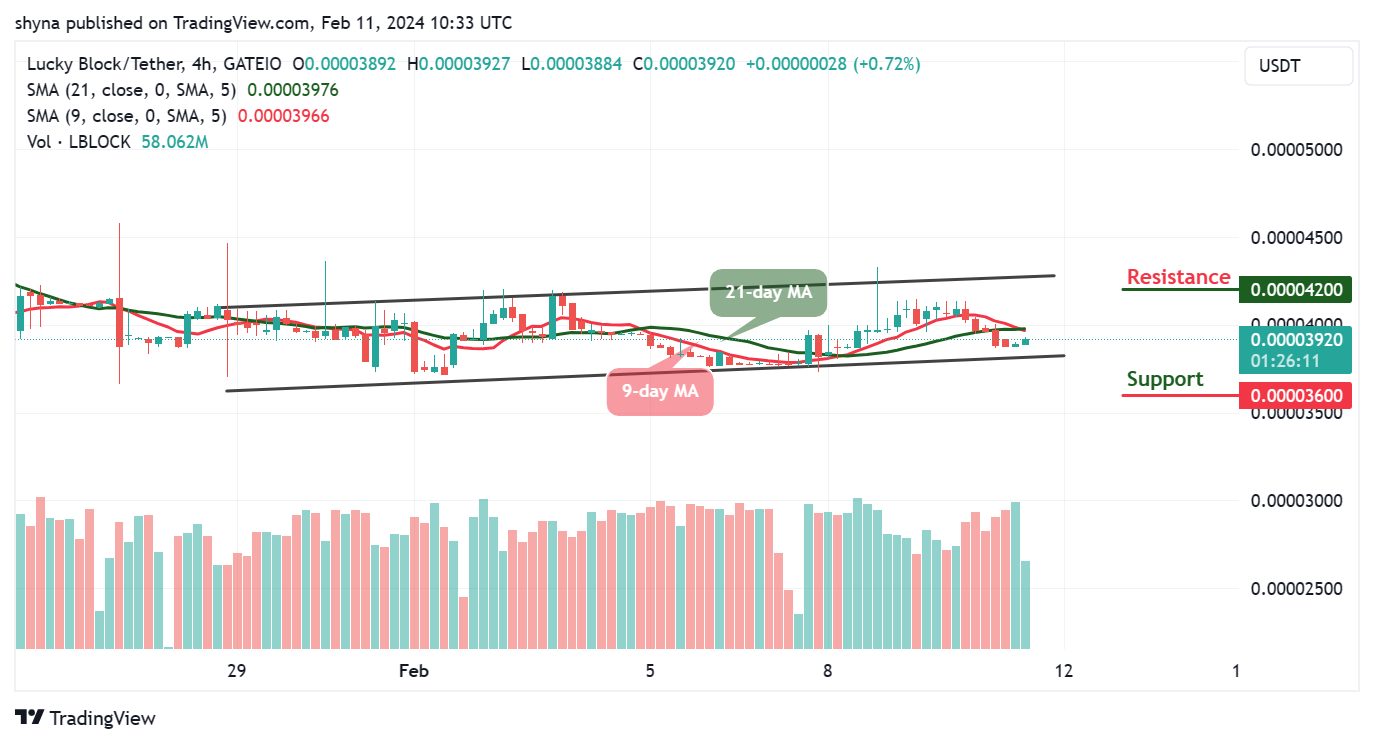
Nonetheless, if the bulls push the market price to hit the resistance level of $0.000400, traders may expect the coin to spike toward the upper boundary of the channel, breaking this barrier may further push the price to the resistance level of $0.000042 and above. At the moment, the 9-day MA is likely to cross below the 21-day MA, which could prepare the coin for additional bullish movement.
You can purchase Lucky Block here. Buy LBLOCK