Lucky Block Price Prediction: LBLOCK/USD Looks Good as Price Hovers at $0.000098 Resistance
Estimated Reading Time: 2 minutes
Don’t invest unless you’re prepared to lose all the money you invest. This is a high-risk investment and you are unlikely to be protected if something goes wrong. Take 2 minutes to learn more
Lucky Block Price Prediction – June 19
The Lucky Block price prediction reveals that as the bulls begin to increase their momentum, the price will head to the upside.
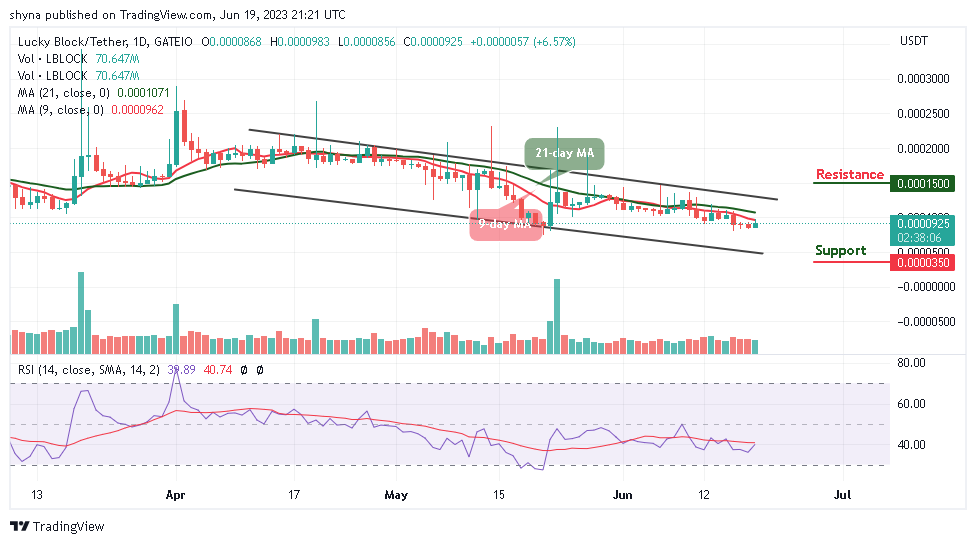
LBLOCK/USD Long-term Trend: Bearish (1D Chart)
Key Levels:
Resistance levels: $0.000150, $0.00160, $0.000170
Support levels: $0.000035, $0.000025, $0.000015
LBLOCK/USD is moving bearishly as the coin moves to cross above the 9-day and 21-day moving averages. However, the bullish momentum is coming to play in the market soon, and the bullish pressure could break the $0.000100 level. Moreover, if the bulls fail to drive the price higher, the Lucky Block price could consolidate within a little time before heading to the north.
Lucky Block Price Prediction: LBLOCK/USD Faces the Upside
The Lucky Block price is changing hands at $0.000092 where it will make a cross above the moving averages. As soon as the coin move near the upper boundary of the channel, it will locate the potential resistance levels at $0.000150, $0.000160, and $0.000170 while the support levels could be found at $0.000035, $0.000025, and $0.000015 for the new entries as the technical indicator Relative Strength Index (14) moves to cross above 40-level.
LBLOCK/USD Medium-term Trend: Ranging (4H Chart)
The Lucky Block price keeps moving above the 9-day and 21-day moving averages. The technical indicator Relative Strength Index (14) also confirms the sideways movement as the signal line moves in the same direction above the 40-level. This could be the best time for both the new and the old buyers to invest more in the coin as any bullish movement above the upper boundary of the channel could push the coin to the resistance level at $0.000115 and above.
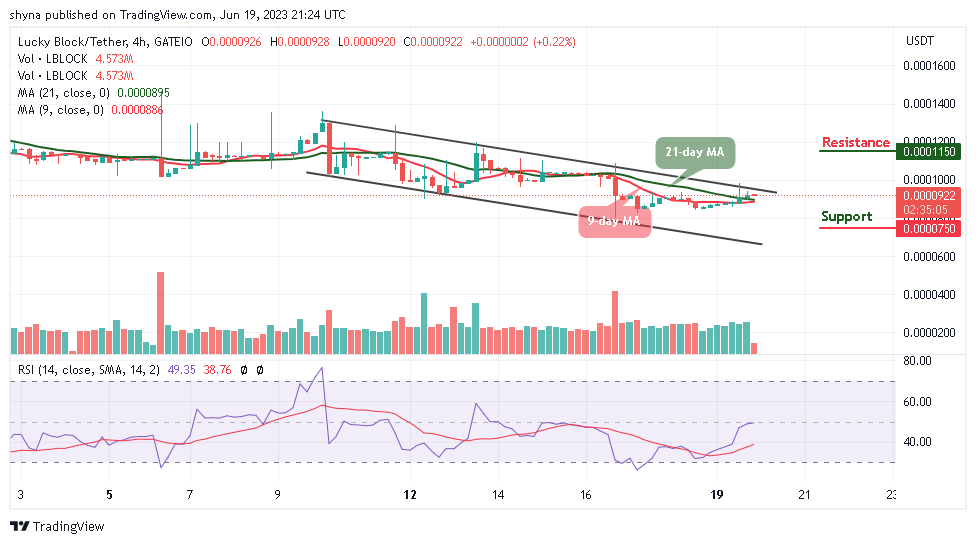
According to the 4-hour chart, LBLOCK/USD will begin to display some bullish signals immediately after the sideways movement, and this will cause the market price to face the upside, but if the price drops and heads toward the lower boundary of the channel, it could touch the nearest support at $0.000075 and below.
You can purchase Lucky Block here. Buy LBLOCK