ZKsync (ZK/USDT) Signals Renewed Bullish Interest Despite Overbought Condition
Estimated Reading Time: 3 minutes
Don’t invest unless you’re prepared to lose all the money you invest. This is a high-risk investment and you are unlikely to be protected if something goes wrong. Take 2 minutes to learn more

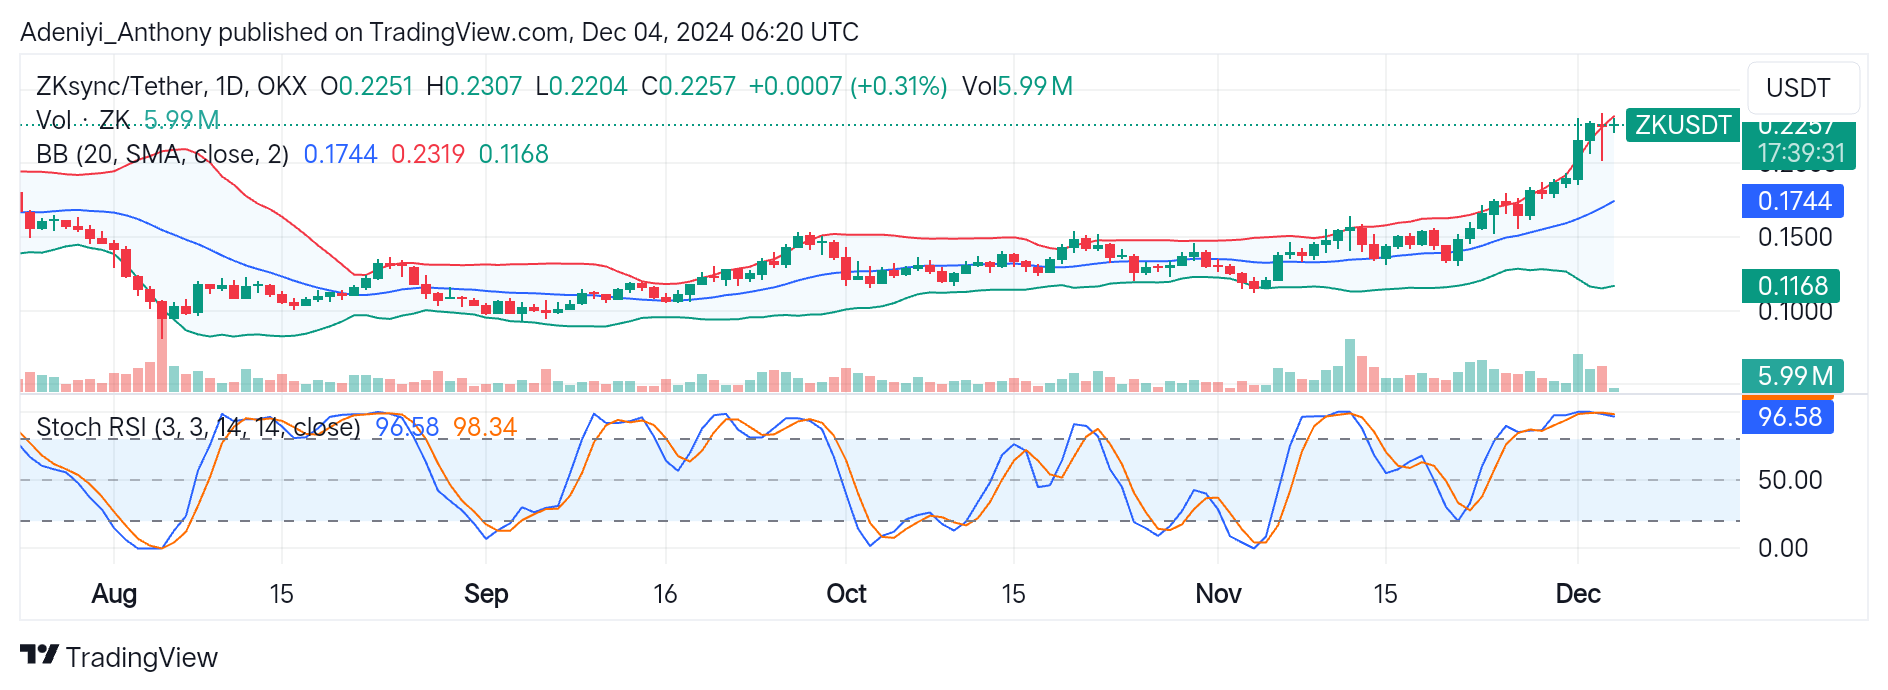
Zksync against the Tether on a daily timeframe has witnessed increased momentum over time, as seen in the formation of a new high and the continuation of the bullish rally after breaking above the 0.2200 resistance level.
Recently, ZK/USDT has signaled a renewed interest with a small bullish candlestick near the upper band at $0.2319 and a daily trading volume of 5.99 million. However, the Stochastic RSI signals an overbought condition for the pair, suggesting that potential retracement might be on the horizon.
Currently, Zksync is trading at $0.2257; this represents a 0.31% trade above the previous session.
Technical Indicators
Major Resistance Levels: $0.2319, $0.2500, and $0.3000
Major Support Levels: $0.1744, $0.1500, and $0.1168
Zksync Technical Analysis
The analysis of Zksync against the Tether shows that the pair is experiencing a volume-supported uptrend with price trending along the upper Bollinger band. This reflects a strong bullish momentum. However, this position often hints at the possibility of a short-term correction.
Additionally, the Stochastic RSI suggests the pair is significantly overbought with the lines reading above 90. This further reinforces the likelihood of a price retracement as traders may look to take profits.
However, for the continuation of the bullish rally above $0.2319, the current trading volume that confirms renewed bullish interest must be sustained; otherwise, a drop in the volume may confirm a retracement towards $0.1744 before another upside movement.
ZK/USDT Analysis: What’s Next?
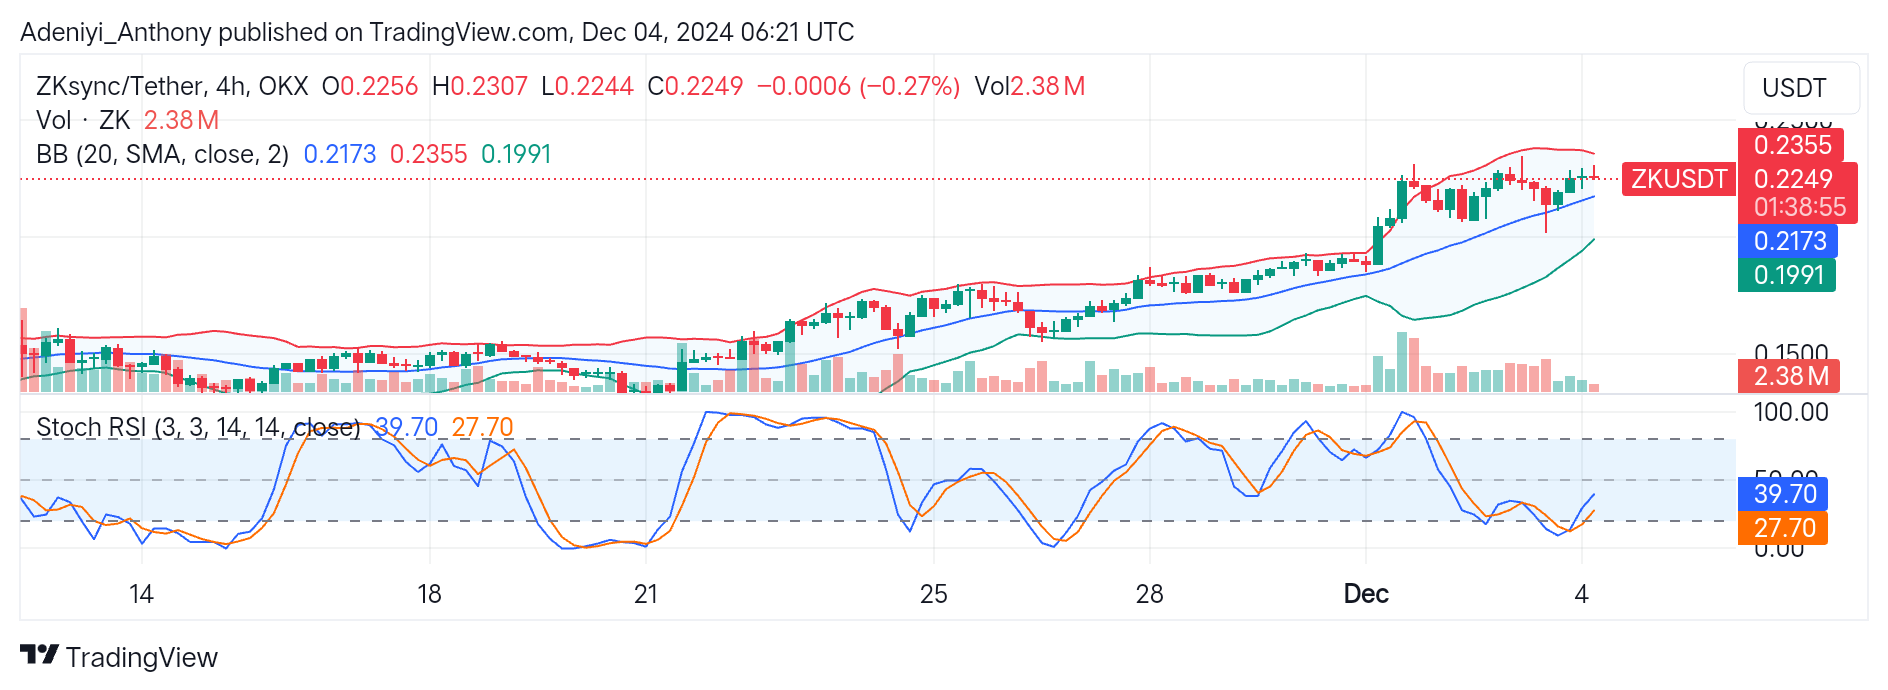
On the daily timeframe, ZK/USDT has been hovering in a tight range after failing to break above the $0.2249 level. However, the formation of a bearish candlestick and positioning of the price above the 20-period simple moving average suggest the bulls are still in the market.
On the other hand, the Stochastic oscillator signals that the pair is operating in the oversold region, with the lines reading below 40. However, the direction to which the lines are pointing suggests that the price may see an upside movement in the near term, provided there is an increase in the trading volume.
To this end, a break below $0.2173 would indicate the beginning of a downtrend, while a breakout above $0.2355 would indicate an uptrend away from the current range.
You can purchase crypto coins here. Buy LBlock