ZKsync (ZK/USDT) Shows Noticeable Bullish Momentum Amid Overbought Condition
Estimated Reading Time: 3 minutes
Don’t invest unless you’re prepared to lose all the money you invest. This is a high-risk investment and you are unlikely to be protected if something goes wrong. Take 2 minutes to learn more

In recent weeks, ZKsync has shown resilient and strong bullish momentum by breaking out of a previous consolidation phase and challenging higher resistance levels.
The daily candlestick chart of the Zksync against the Tether reflects a strong uptrend supported by rising volume. This signals the growing interest from the bullish traders. Recent price movements reveal a steady climb from the $0.1500 level, where the pair has been consolidating to $0.1880, the current level.
To this end, the market sentiment for the pair appears optimistic, as the indicators on the chart suggest that bullish traders dominate the current market. However, traders may anticipate a short-term correction before resuming the uptrend.
Currently, the ZK/USDT is traded for $0.1880, supported by 4.51 million traded volumes, and it is up by a slight margin of 0.53%.
Technical Indicators
Major Resistance Levels: $0.1916, $0.2000, and $0.2200
Major Support Levels: $0.1592, $0.1268, and $0.1000
ZKsync Technical Analysis
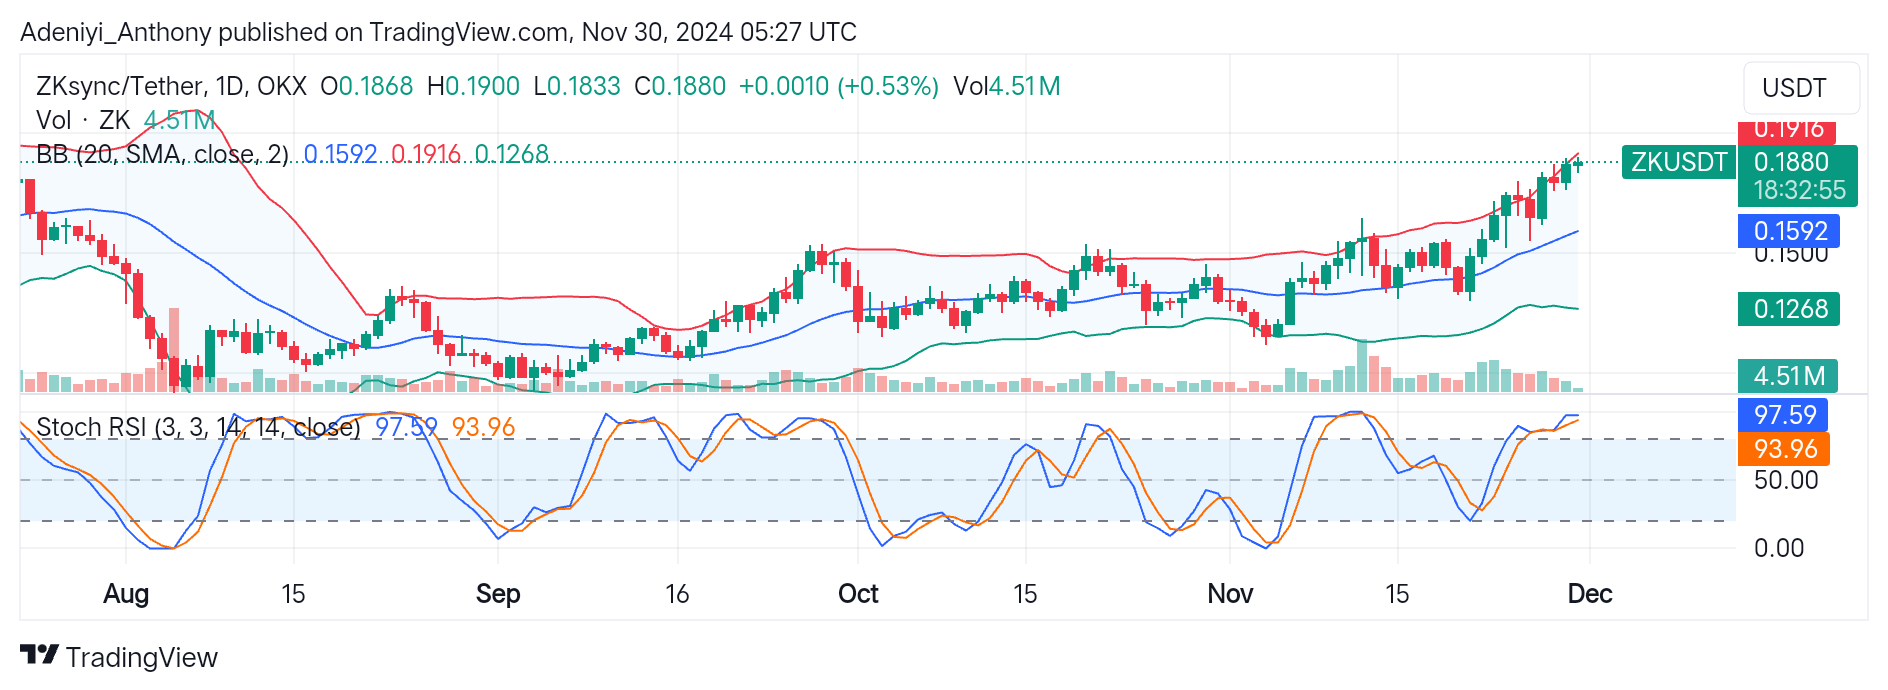
The analysis of ZKsync against the Tether shows the pair has been on a steady uptrend for a considerable period. The current price movement around the upper Bollinger band suggests the pair seeks to attain new heights as seen in the formation of the higher highs and lows with the current uptick.
However, price activity close to the $0.1916 level suggests the ZKsync against the Tether is overextended and a retracement to the $0.1592 midline may occur soon. Conversely, sustained momentum with an increased volume is critical for breaking above $0.1916 for the new resistance level.
The Stochastic RSI at the bottom of the chart shows the ZK/USDT in an overbought condition, with the %k and %D lines reading 97.59 and 93.96, respectively. This signals a potential correction to the South, as the pair seems unsustainable. Therefore, a dip below the 80-mark level with a fall in traded volume may signal the start of a retracement.
ZK/USDT Analysis: What’s Next?
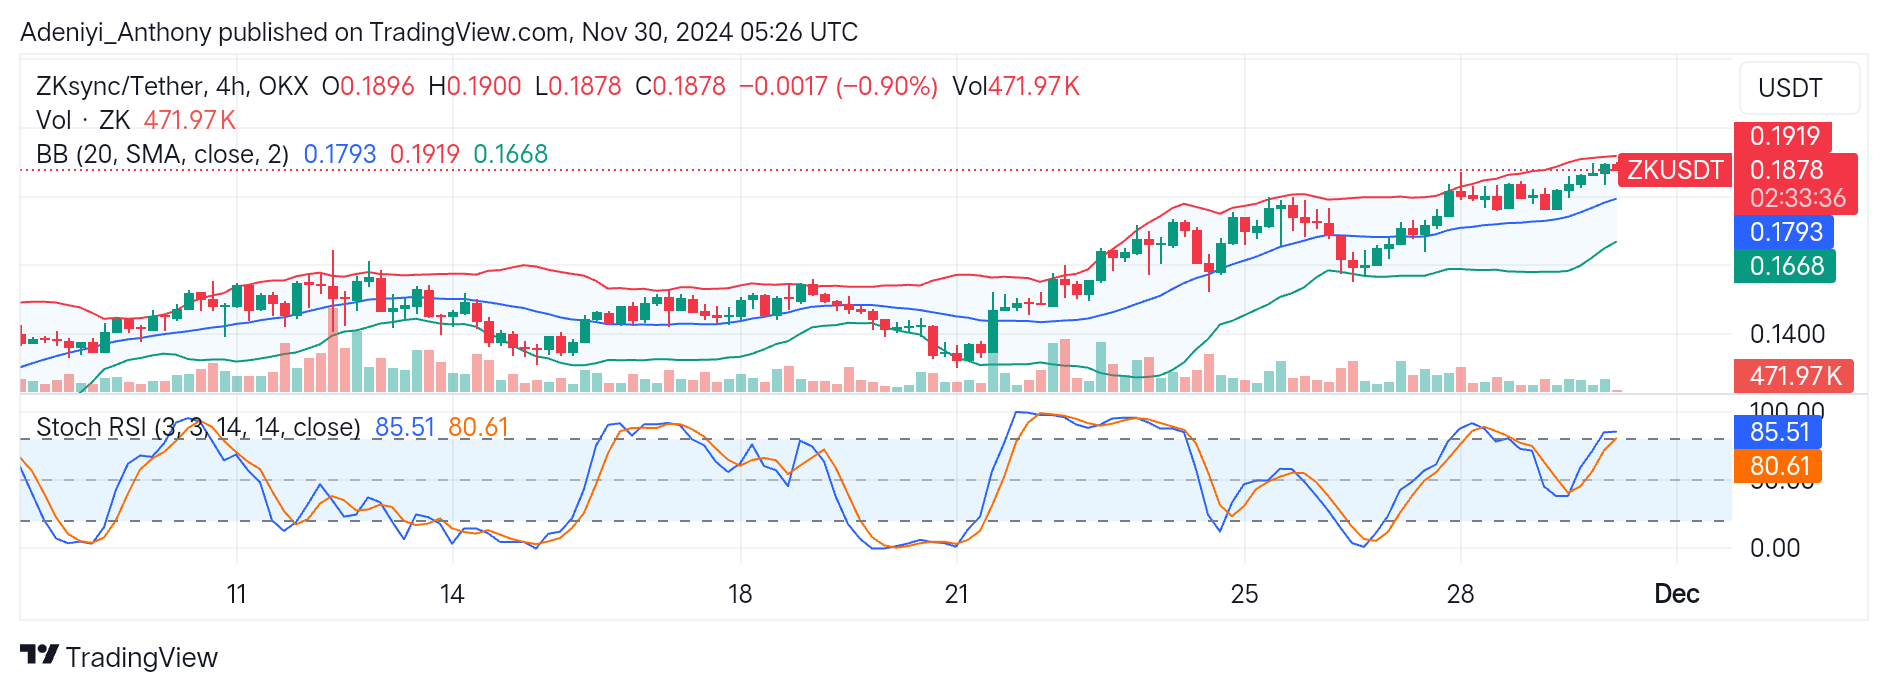
The analysis of ZK/USDT on the 4H chart shows the pair is experiencing bullish momentum, with the formation of higher highs and lows. However, the uptrend seems to be facing selling pressure around the $0.1919 level. The lines of the Bollinger bands are converging—a sign of reduced volatility that precedes a breakout.
In the meantime, ZK/USDT may retrace to the dynamic mid-band at $0.1793, and price action around that level will determine the next course of action. A dip below the mid-band would signal the beginning of a downtrend. Conversely, the price may be above $0.1919 with a renewed bullish interest and an increased volume.
Additionally, the Stochastic oscillator indicates the pair is slightly overbought with much room for improvement. However, the curvature of the lines at 85.51 and 80.61 suggests the pair may see a downturn in the near term. To this end, traders need to monitor the behavior of the lines, as a dip below the 80-mark level will signal the beginning of a downtrend.
You can purchase crypto coins here. Buy LBlock