Lucky Block Price Prediction: LBLOCK/USD Moves to Retrace the Lost Resistance
Estimated Reading Time: 3 minutes
Don’t invest unless you’re prepared to lose all the money you invest. This is a high-risk investment and you are unlikely to be protected if something goes wrong. Take 2 minutes to learn more
Lucky Block Price Prediction – January 14
The Lucky Block price prediction breaks above the resistance level of $0.000187 during the European session today.
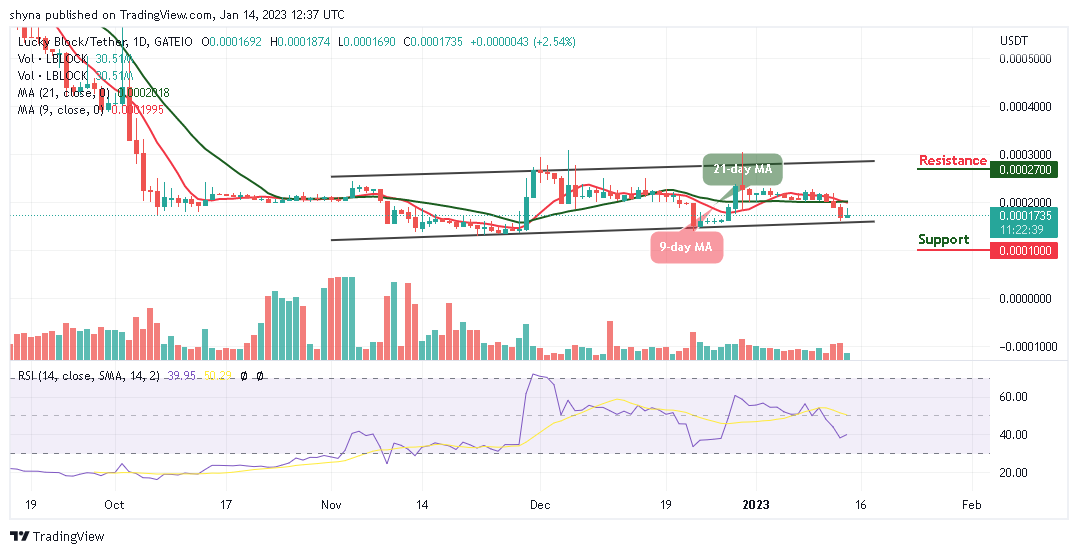
LBLOCK/USD Medium-term Trend: Ranging (1D Chart)
Key Levels:
Resistance levels: $0.000270, $0.000290, $0.000310
Support levels: $0.000100, $0.000080, $0.000060
LBLOCK/USD is preparing for a move higher as the coin pulls back below $0.000187. This movement is necessary for the entry of new investors into the market. Meanwhile, if the sellers push the market lower, the bears can look for immediate support around the $0.000170 level.
Lucky Block Price Prediction: LBLOCK/USD Gets Ready for a Rebound
The Lucky Block price is below the 9-day and 21-day moving averages; the coin is preparing for a bullish movement as this could be a good opportunity for existing buyers. Meanwhile, the Relative Strength Index (14) technical indicator is moving to cross above the 40-level, any bearish movement below the lower boundary of the channel could hit the supports at $0.000100, $0.000080, and $0.000060.
On the contrary, should the buyers hold the current market at $0.000173 and push it towards the upper boundary of the channel, the bulls can look forward to the hit the potential resistance levels at $0.000270, $0.000290, and $0.000310.
LBLOCK/USD Medium-term Trend: Bearish (4H Chart)
On the 4-hour chart, the Lucky Block (LBLOCK) moves toward the south as the buyers are gaining momentum and this could push the coin to cross above the 9-day and 21-day moving averages.
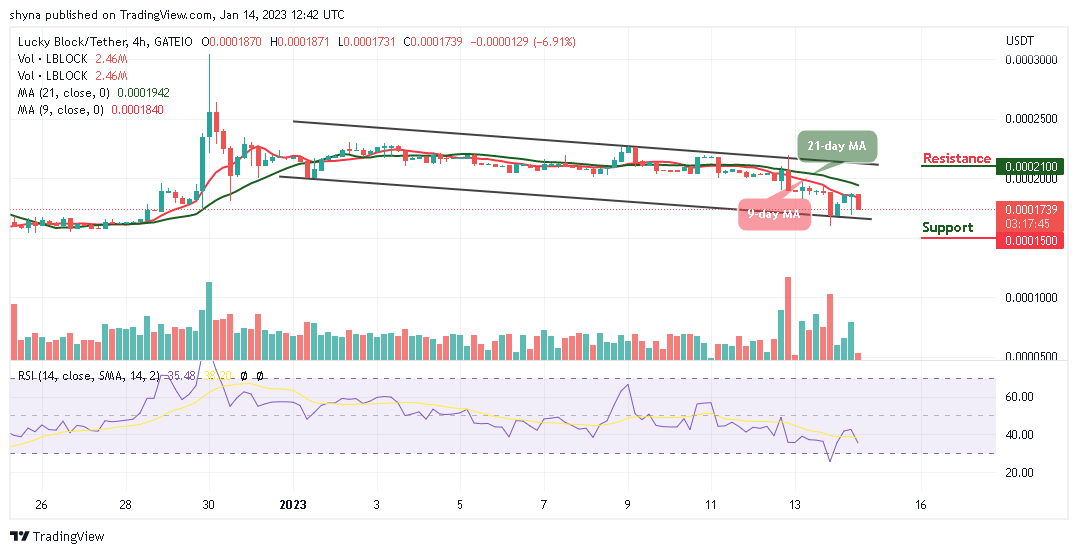
Looking at the market, the sellers are making effort to bring the coin toward the lower boundary of the channel, but the deeper it goes; the more buyers are expected to buy the dips. Once this is done, LBLOCK/USD could hit the resistance level at $0.000210 and above, but any further bearish movement could touch the support at $0.000150 and below as the technical indicator Relative Strength Index (14) moves toward the 30-level.
You can purchase Lucky Block here. Buy LBLOCK