Lucky Block Price Prediction: LBLOCK/USD Poised for Another Bullish Surge Beyond $0.000072
Estimated Reading Time: 3 minutes
Don’t invest unless you’re prepared to lose all the money you invest. This is a high-risk investment and you are unlikely to be protected if something goes wrong. Take 2 minutes to learn more
Lucky Block Price Prediction – March 3
The Lucky Block price prediction indicates a bullish trend for LBLOCK, suggesting an upward trajectory shortly.
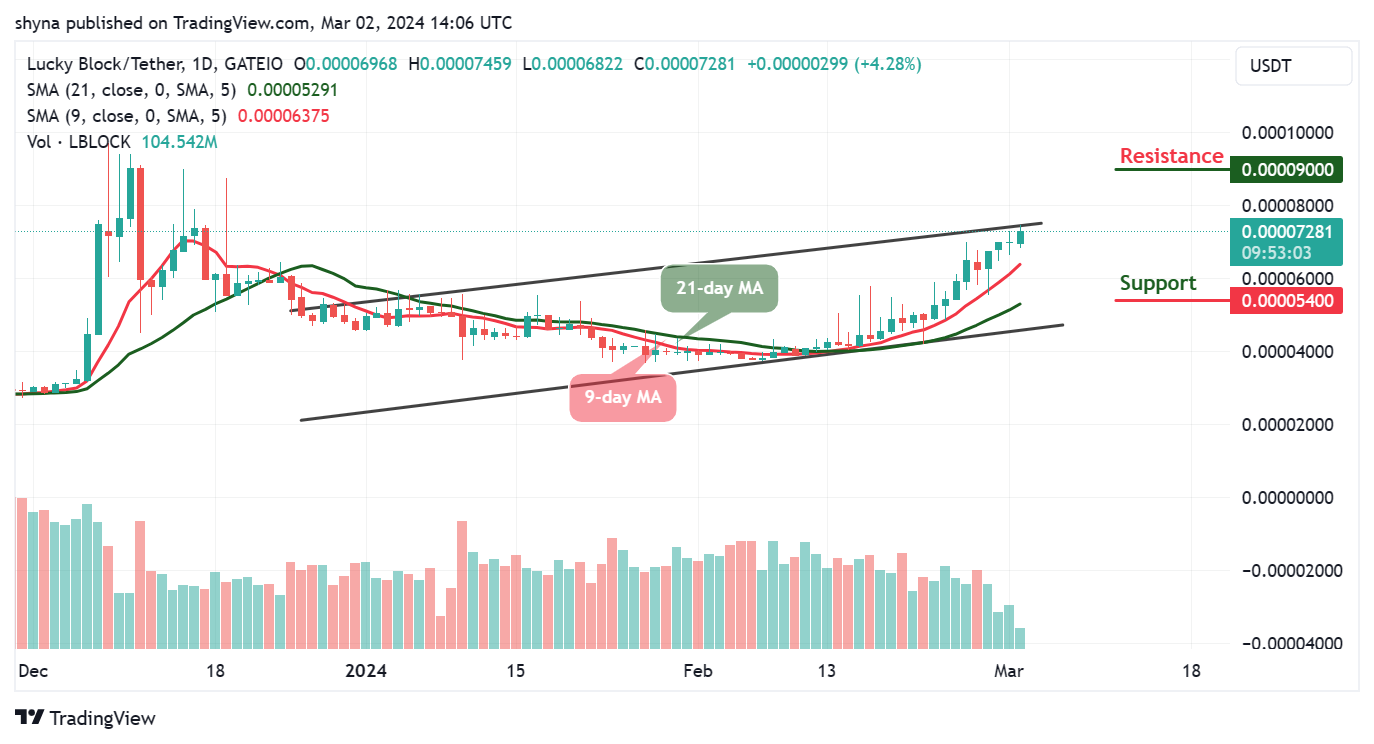
LBLOCK/USD Long-term Trend: Bullish (1D Chart)
Key Levels:
Resistance levels: $0.000090, $0.000095, $0.000100
Support levels: $0.000054, $0.000049, $0.000044
Observing the daily chart, LBLOCK/USD shows upward momentum, maintaining its position above the 9-day and 21-day moving averages, reaching a daily high of $0.000074. A potential breakthrough above this level could lead the coin toward the resistance at $0.000075. However, sustained buyer interest is essential to propel Lucky Block’s price further upward, ensuring it remains above the moving averages.
Lucky Block Price Prediction: LBLOCK/USD Will Shoot Above the Channel
The Lucky Block price is anticipated to reclaim the resistance level of $0.000074, with further bullish momentum potentially targeting resistance levels at $0.000090, $0.000095, and $0.000100. Despite this positive outlook, the 9-day moving average continuing above the 21-day moving average suggests potential for further upside gains. However, in the event of a downtrend, support levels at $0.000054, $0.000049, and $0.000044 may come into play. For investors, this phase could present an opportune moment to consider investment in the coin.
LBLOCK/USD Medium-term Trend: Ranging (4H Chart)
The Lucky Block (LBLOCK) is currently exhibiting a bearish trend, trading above both the 9-day and 21-day moving averages. Further downward momentum could potentially breach this barrier, leading to a decline in the coin’s value. However, it’s worth noting that the 9-day moving average remains comfortably above the 21-day moving average, presenting an opportune moment for both existing buyers to reinvest and new buyers to enter the market.
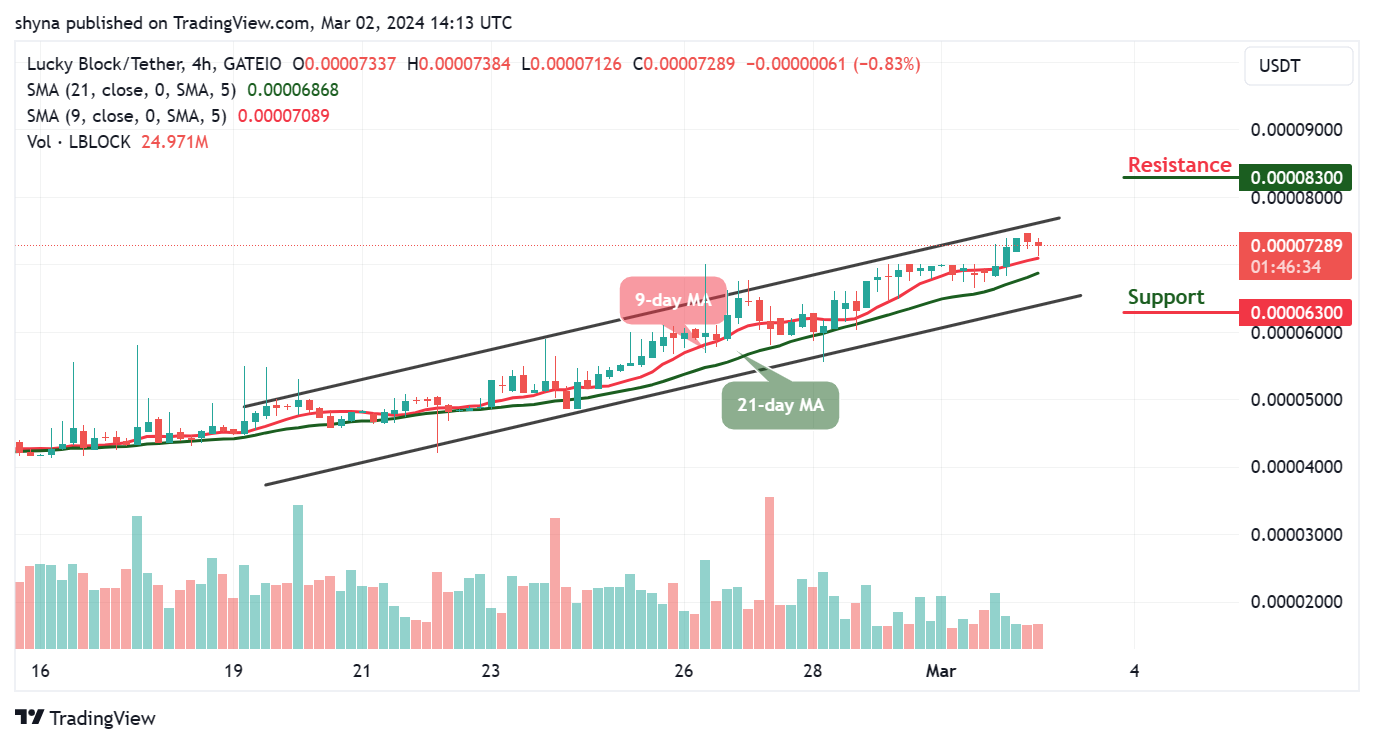
If bullish pressure pushes the market price beyond the upper boundary of the channel, Lucky Block may encounter resistance around the $0.000083 level and above. Conversely, if the market experiences bearish movement towards the lower boundary of the channel, a support level around $0.000063 and below may be identified.
You can purchase Lucky Block here. Buy LBLOCK