Lucky Block Price Prediction: LBLOCK/USD Range-Bounds for More Buyers to Surface
Estimated Reading Time: 3 minutes
Don’t invest unless you’re prepared to lose all the money you invest. This is a high-risk investment and you are unlikely to be protected if something goes wrong. Take 2 minutes to learn more

Free Crypto Signals Channel
The Lucky Block price prediction is getting ready to recover to the upside as the coin keeps moving around the $0.0017.
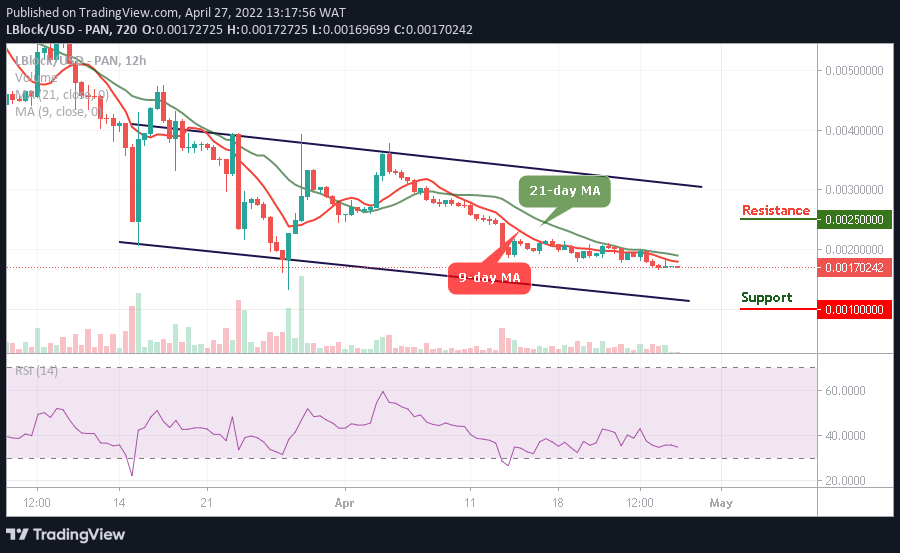
LBLOCK/USD Medium-term Trend: Ranging (12H Chart)
Key Levels:
Resistance levels: $0.0025, $0.0027, $0.0029
Support levels: $0.0010, $0.0008, $0.0006
LBLOCK/USD is moving sideways as the market price prepares to resume upside. The Lucky Block price is likely to hit the nearest support at $0.0015 for the new buyers to enter the market. However, should the bulls fail to push the price upward, the Lucky block price may continue sideways before heading the north.
Lucky Block Price Prediction: LBLOCK/USD Would Move Higher
The Lucky Block price is hovering below the 9-day and 21-day moving averages. The coin will begin to rise as soon as the bulls defend the $0.0016 support level. Therefore, any further bullish movement may push the price to the potential resistance levels of $0.0025, $0.0027, and $0.0029.
On the other hand, the upward movement may be delayed if the coin remains below the moving averages, any further bearish movement may touch the support levels of $0.0010, $0.0008, and $0.0005. Moreover, the technical indicator Relative Strength Index (14) moves below 50-level to prepare the coin for the upward movement.
LBLOCK/USD Medium-term Trend: Ranging (4H Chart)
Against Bitcoin, the Lucky Block price moves to cross above the 9-day and 21-day moving averages to touch the major resistance level at $0.0018. However, if the buyers push the price above this level, higher resistance could be located at $0.0020 and above.
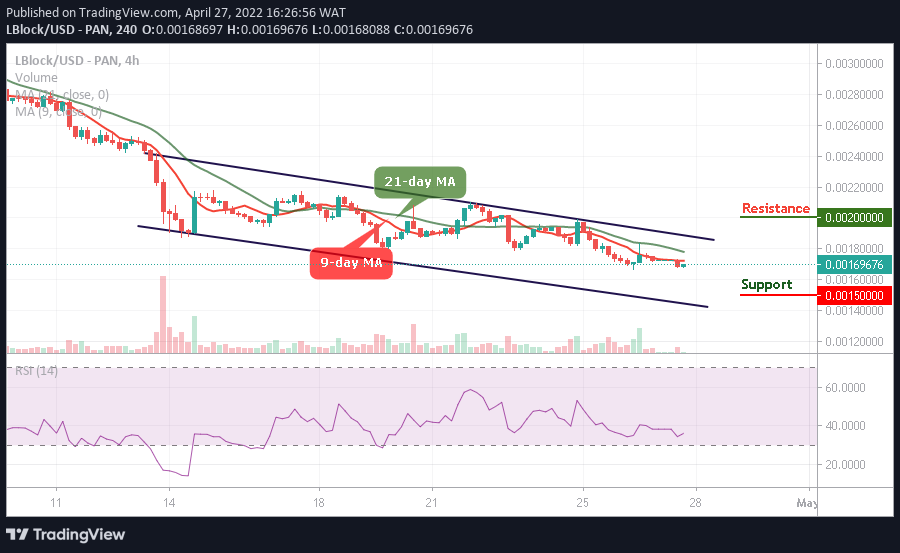
Moreover, the technical indicator Relative Strength Index (14) will cross above the 40-level, indicating that bullish signals are coming to play. On the contrary, should the bulls fail to move the current market value above, the bears may step back into the market, and the nearest support level could be found at $0.0015 and below.
Read more: