Lucky Block Price Prediction: LBLOCK/USD Ranges as Price Prepares for a Bullish Movement
Estimated Reading Time: 3 minutes
Don’t invest unless you’re prepared to lose all the money you invest. This is a high-risk investment and you are unlikely to be protected if something goes wrong. Take 2 minutes to learn more

Free Crypto Signals Channel
The Lucky Block price prediction may begin to form higher as the bears would lose grip over the coin soon.
LBLOCK/USD Market
Key Levels:
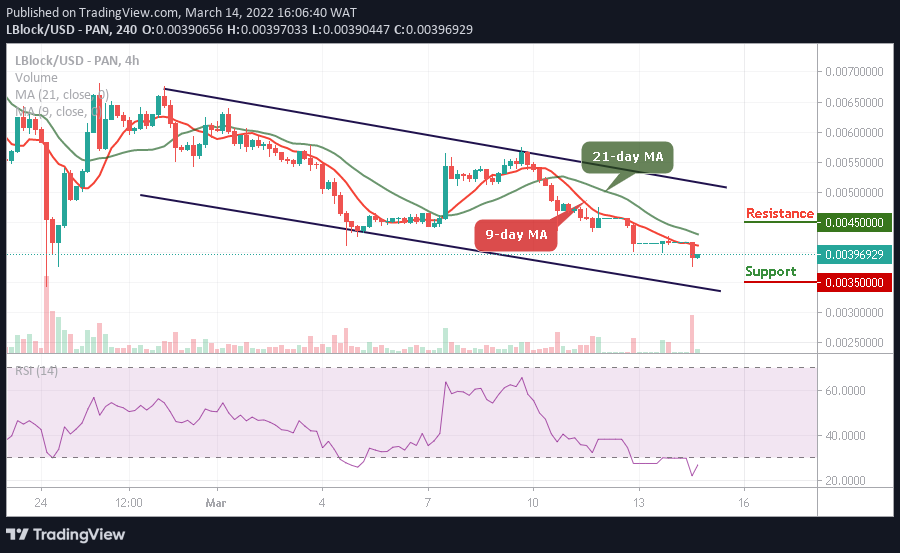
Resistance levels: $0.00700, $0.00750, $0.00800
Support levels: $0.00540, $0.00490, $0.00440
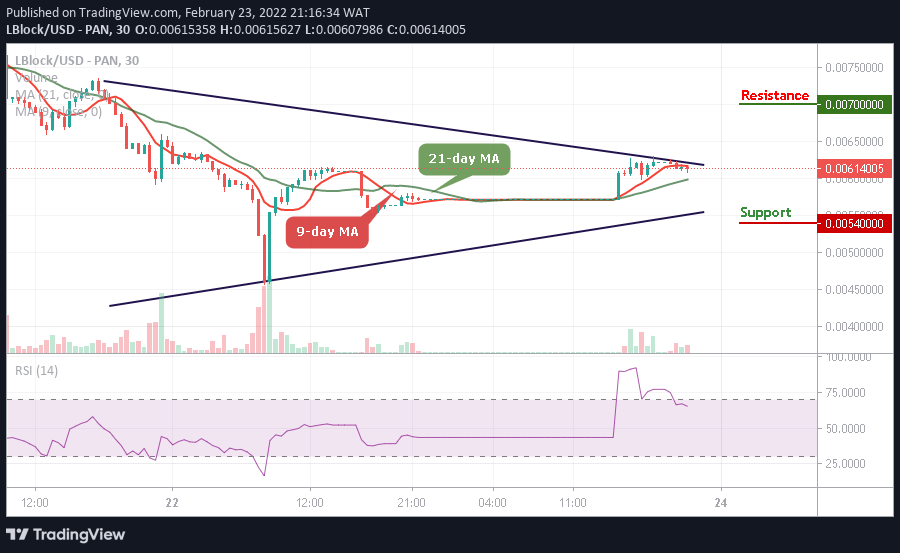
At the time of writing, LBLOCK/USD is moving sideways as the market price prepares to cross above the 9-day moving average. Meanwhile, the bullish momentum is propelling the coin around the $0.00614 level as the bullish pressure could break up the $0.00650 level. However, should the bulls fail to push the price upward, the Lucky block price may consolidate for a while so that new buyer can come into the market.
Lucky Block Price Prediction: Would LBLOCK/USD Move Higher?
The Lucky Block price would rise and break above the upper boundary of the channel immediately the bulls defends the $0.00600 support level. Therefore, any further bullish movement towards the upside may push the price to the potential resistance levels of $0.00700, $0.00750, and $0.00800.
In the meantime, this analysis may be invalidated if the bears break below the lower boundary of the channel and fall to the support levels of $0.00540, $0.00490, and $0.00550. Moreover, the technical indicator Relative Strength Index (14) is moving around 70-level to give more bullish movements in the next positive directions.
LBLOCK/USD Medium-term Trend: Ranging (15 Minutes Chart)
According to the 15-minute chart, the Lucky Block price is ranging below the 9-day and 21-day moving averages. The bullish are seen gathering momentum in other to push the coin above the upper boundary of the channel. The long-term moving averages may keep the bullish movement as the market prepares for a new trend.
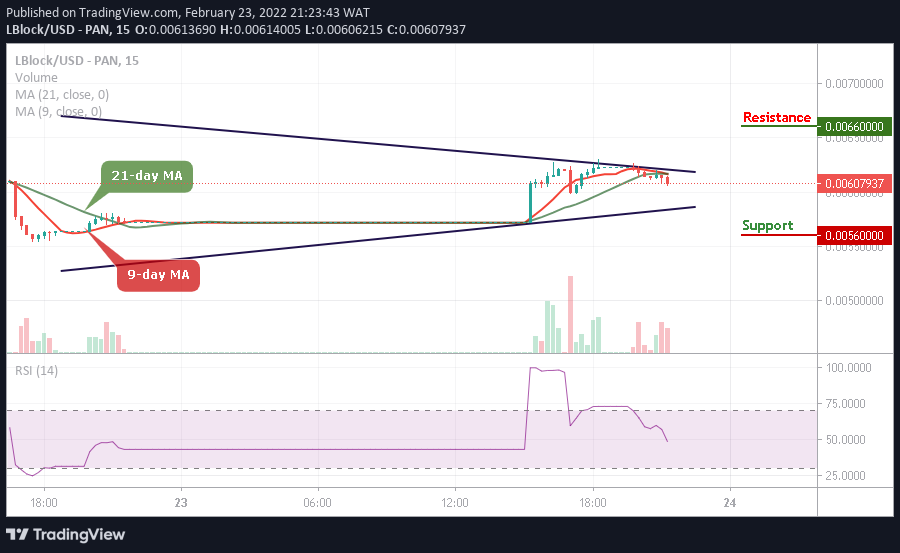
However, if the buyers push the price and move towards the upper boundary of the channel, higher resistance could be reached at $0.00660 and above while the technical indicator Relative Strength Index (14) stays below 50-level, indicating that the buyers should get ready for a spike to the positive side. On the contrary, if the bulls fail to move the current market value above, the bears may bring the market to the support level of $0.00560 and below.
Read more: