Lucky Block Price Prediction: LBLOCK/USD Ready to Break Up Resistance Level of $0.0050
Estimated Reading Time: 3 minutes
Don’t invest unless you’re prepared to lose all the money you invest. This is a high-risk investment and you are unlikely to be protected if something goes wrong. Take 2 minutes to learn more

Free Crypto Signals Channel
The Lucky Block price prediction is consolidating, if the bulls increase their momentum and penetrate the resistance level at $0.0050 with the daily candle close above it, then, the price would shoot higher.
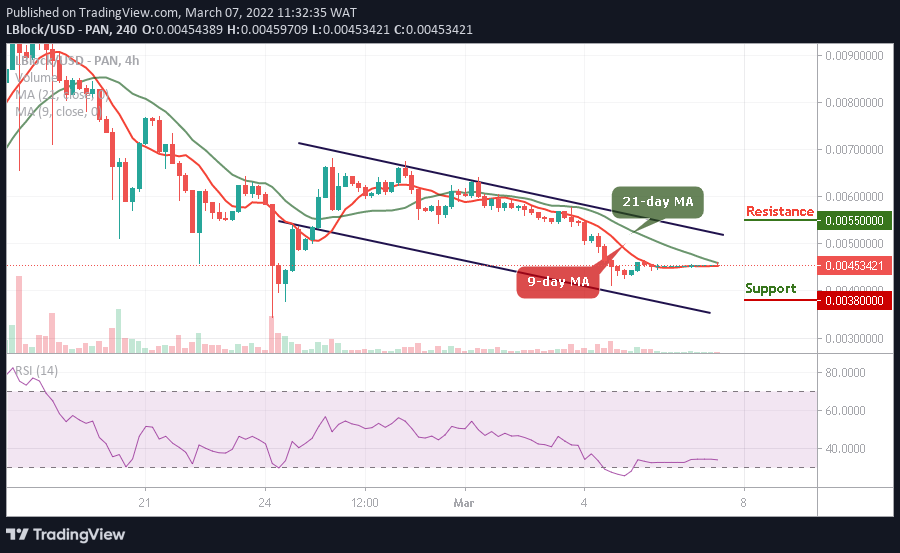
LBLOCK/USD Long-term Trend: Bearish (4 Hour Chart)
Key Levels:
Resistance levels: $0.0055, $0.0060, $0.0065
Support levels: $0.0038, $0.0033, $0.0028
LBLOCK/USD is ready for the upside as the coin prepares for a recovery above the 9-day and 21-day moving averages. If the bulls increase their momentum and penetrate the resistance level at $0.0050, then, the price would shoot higher.
Lucky Block Price Prediction: LBLOCK Price Ready for The Upside
Looking at the chart, if the Lucky Block price can experience an increasing volume coupled with a bullish regroup, it will begin to correct gain significantly on the upside. On the contrary, the bears may likely become severe with more losses for the new buyers to enter. However, the next support level could be located at $0.0038, $0.0033, and $0.0028.
Nevertheless, the Lucky Block price may continue to move sideways as the coin prepares for the upside to hit the potential resistance levels of $0.0055, $0.0060, and $0.0065. The technical indicator Relative Strength index (14) is moving in the same direction below 40-level, suggesting sideways movement for the coin.
LBLOCK/USD Medium-term Trend: Bearish (2 Hour Chart)
The Lucky Block is crossing above the 9-day and 21-day moving averages as revealed in the chart, but the coin is getting ready for the upward movement. Therefore, should the price break above the upper boundary of the channel, the market may experience an upward trend which could touch the resistance level at $0.0055 and above.
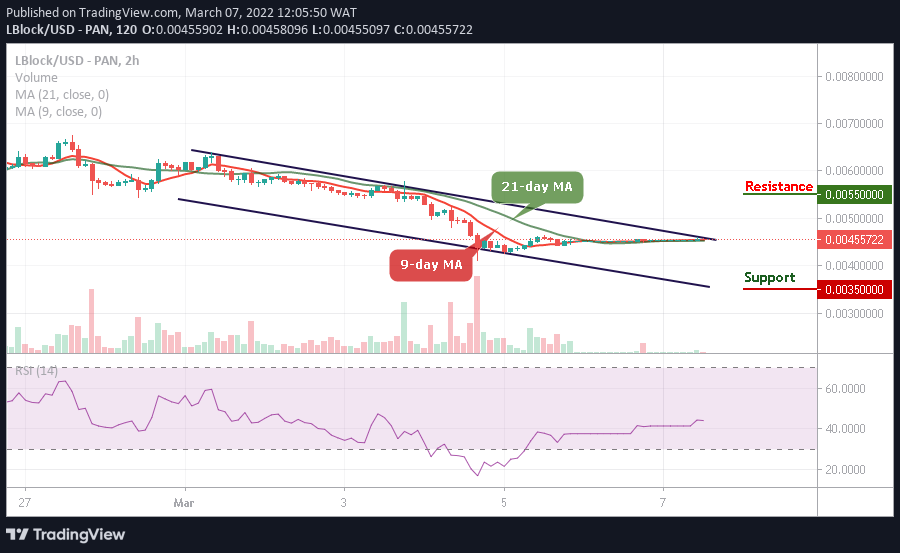
Meanwhile, LBLOCK/USD stays around the moving averages, if the coin breaks below this barrier; it may hit the support at $0.0035 and below. However, the technical indicator Relative Strength Index (14) moves above 40-level, which may push the coin to the positive side.
Read more: