Lucky Block Price Prediction: LBLOCK/USD Regains Bullish Momentum as Price Spike Above $0.0007
Estimated Reading Time: 3 minutes
Don’t invest unless you’re prepared to lose all the money you invest. This is a high-risk investment and you are unlikely to be protected if something goes wrong. Take 2 minutes to learn more

Free Crypto Signals Channel
The Lucky Block price continued to rise as it revisits $0.0007. It will resume upside momentum if the price breaks to the upside.
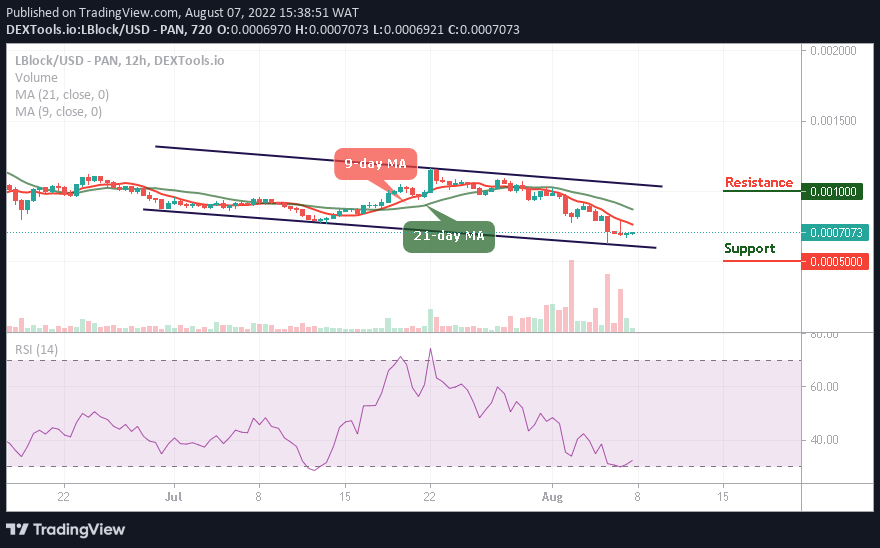
LBLOCK/USD Long-term Trend: Ranging (12H Chart)
Key Levels:
Resistance levels: $0.0010, $0.0012, $0.0014
Support levels: $0.0005, $0.0003, $0.0001
A bullish run will continue to play out as long as LBLOCK/USD increases the bullish movement. The Lucky Block price is currently facing a potential resistance at the $0.0008 level above the 9-day moving average. A break above the 21-day moving average would produce a huge green candle towards the upper boundary of the channel, marking resistance at $0.0010, $0.0012, and $0.0014 levels.
Lucky Block Price Prediction: LBLOCK Price Moves to the Upside
The Lucky Block price is moving bullishly as the coin moves to cross above the 9-day moving average. On the other hand, a slight retreat may bring the market below the lower boundary of the channel with a possible break to the supports at $0.0005, $0.0003, and $0.0001, giving room for the new buyers to enter. Looking at it positively, the technical indicator Relative Strength Index (14) is recovering from the downside, suggesting bullish movement.
LBLOCK/USD Medium-term Trend: Bearish (4H Chart)
The Lucky Block price is hovering below the 9-day and 21-day moving averages, but as it appeared, there’s a low amount of buying pressure in the market, which is why the price could not gain more upsides for now. This will be an opportunity for the existing buyers to invest more while the new buyers are expected to enter the market.
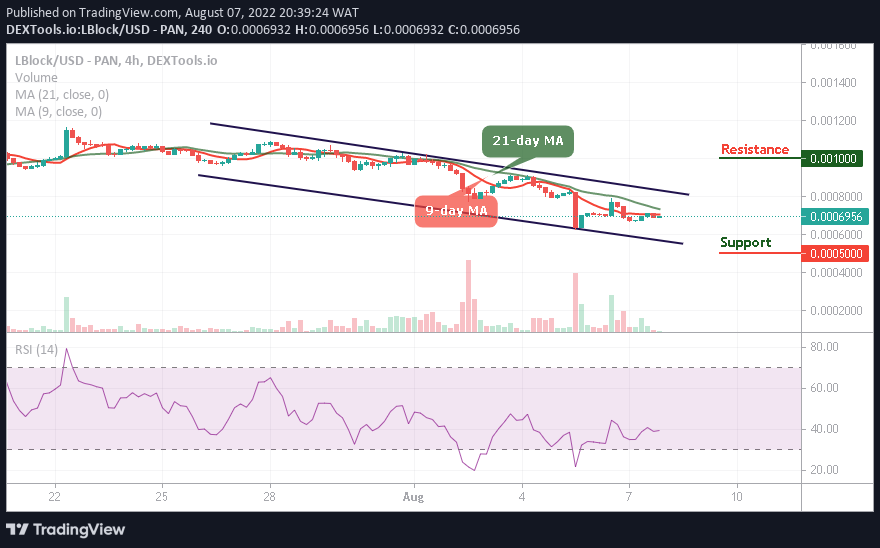
However, if bears try to bring the price below the lower boundary of the channel, one would expect the market to touch the support level of $0.0005 and below. Meanwhile, a bullish continuation would push the price to the resistance level of $0.0010 and above as the technical indicator Relative Strength Index (14) moves to cross above the 40-level.
You can purchase Lucky Block here. Buy LBLOCK

