Tamadoge (TAMAUSD) Initiates a New Bullish Cycle at $0.01000
Estimated Reading Time: 3 minutes
Don’t invest unless you’re prepared to lose all the money you invest. This is a high-risk investment and you are unlikely to be protected if something goes wrong. Take 2 minutes to learn more

During the previous week, the TAMAUSD pair witnessed a notable surge in trading volume. As the week drew to a close, prices soared dramatically, cresting above the $0.01400 mark before a retracement phase ensued. Initially, there was anticipation of a pivotal juncture forming above the $0.012 price threshold. However, the retracement persisted until prices returned to the $0.01000 level, which had served as the launching point for the preceding week’s bullish surge.
Key Levels
- Resistance: $0.013, $0.014, and $0.015.
- Support: $0.010, $0.0091, and $0.0087.

TAMAUSD Price Analysis: The Indicators’ Point of View
The TAMAUSD market went flat at a price level slightly higher than the $0.0100 price level. As a result of this, the Bollinger Bands converge around the market action. The Tamadoge market began to gain significant traction in the second 4-hour session, but by the third session, the market encountered resistance at $0.01074, which is slightly below the 20-day moving average.
If the Bulls can capture this resistance, they might trigger a retracement back on the way to the September 8 high. However, we await confirmation from the Moving Average Convergence and Divergence (MACD), which has yet to have a bullish crossover, even though its negative histograms portray a decline in the bear market.

Tamadoge Short-Term Outlook: 1-Hour Chart
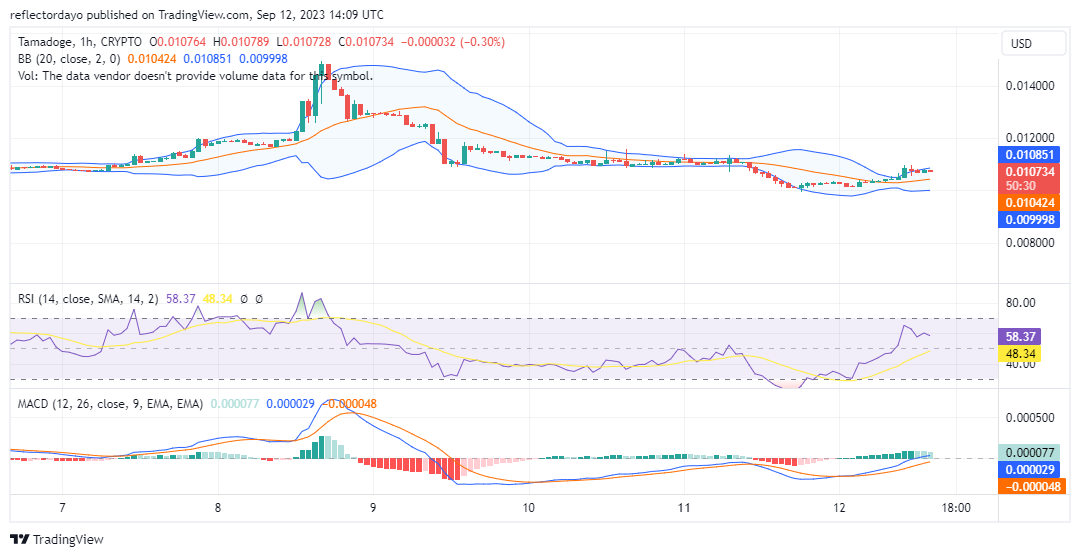
On this smaller chart outlook, the market appears to be struggling at the resistance, as the formation of the very recent candlestick appears as dojis. The contention around the $0.0108 price level has aborted the breakout. Initially, the Bollinger Bands began diverging as the volume trade increased liquidity in both the bull and bear markets, but the bands appear to be reconverging, blending with the horizontally aligned dojis.
The bearish position is clearly enduring pressure from the Tamadoge Bulls. They may eventually give way to this pressure, thereby allowing for another bullish cycle. Traders should keep an eye on this particular price level.
Stay tuned Tamadoge is about to launch three projects this week.
Mystery Project 3 is launching this week… but what will it be? Vote now 🔥
— TAMADOGE (@Tamadogecoin) September 12, 2023
Do you want a coin that will be 100 times more valuable in the next few months? That is Tamadoge. Buy TAMA today!